 |
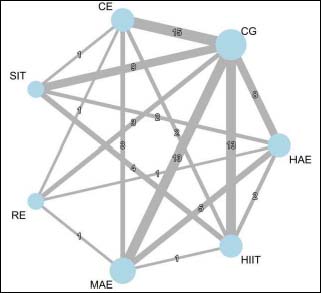
Figure 2.
Network geometry of the comparisons among exercise interventions and the control group for VO2max.
|
|
|
Figure 2.
Network geometry of the comparisons among exercise interventions and the control group for VO2max.
|