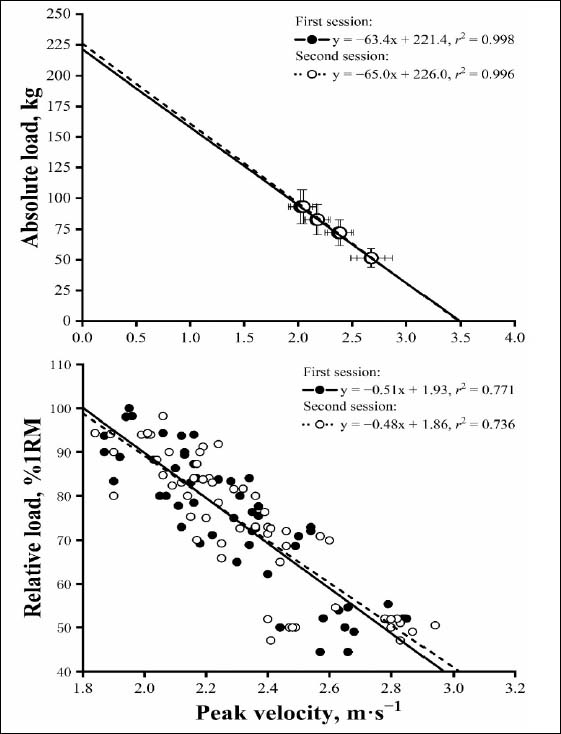
Figure 1.
Averaged across the participants’ relationships between: absolute load and peak velocity (upper-panel), and relative load and peak velocity (lower-panel). The equation and goodness-of-fit (r
2
) are shown. 1RM, 1-repetition maximum.