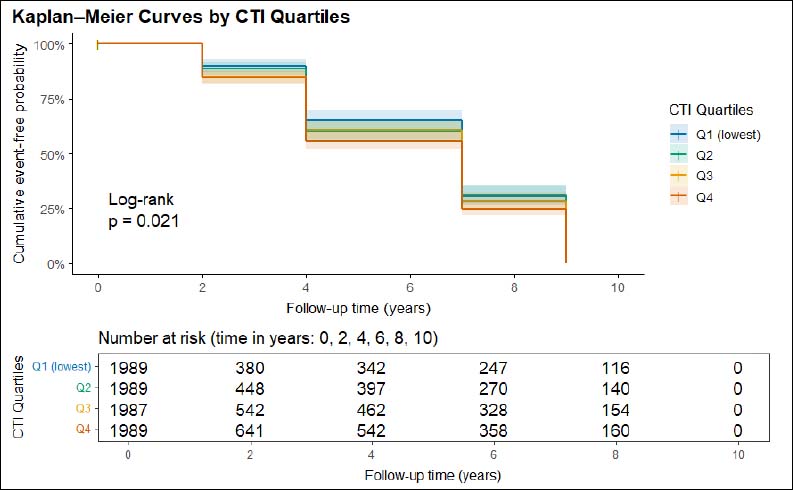
Figure 2.
Kaplan - Meier survival curves showing the cumulative incidence of dyslipidemia across quartiles of the C-reactive protein - triglyceride - glucose index (CTI).