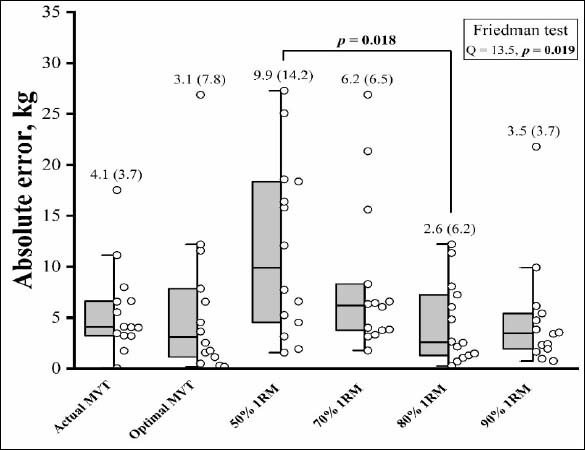
Figure 2. Box plots with median, interquartile range, and individual data points. 1RM indicates one-repetition maximum; 50-90% 1RM, 1RM prediction methods based on the relative load-peak velocity relationship using data from 50-90% 1RM; MVT, minimal velocity threshold. Bold values indicate p < 0.05.