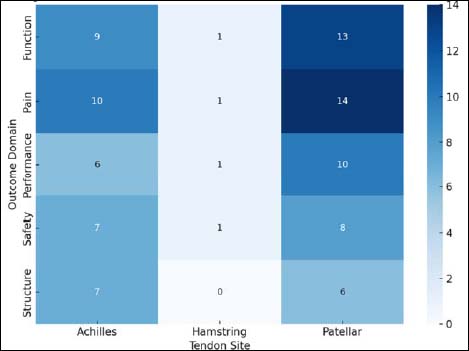
Figure 2.
Heatmap visualizing how commonly each clinical outcome domain is assessed at different tendon sites.