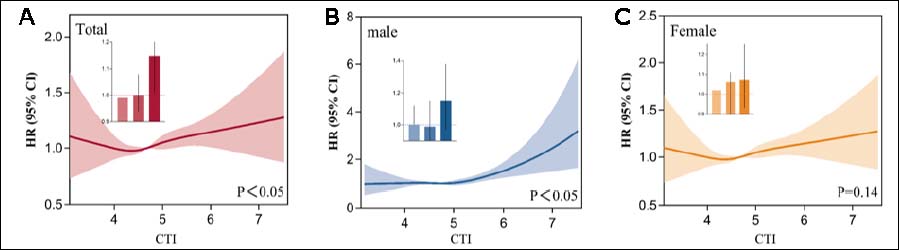
Figure 3.
Restricted cubic spline analyses of the association between the C-reactive protein - triglyceride-glucose index (CTI) and risk of dyslipidemia in the overall population (A), male (B), and female (C).