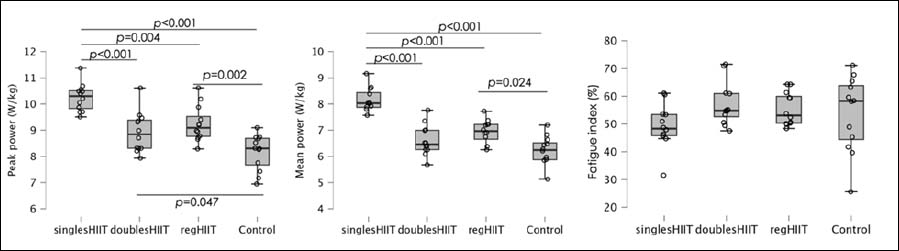
Figure 3.
Boxplots of post-test anaerobic Wingate measures comparing the four groups.