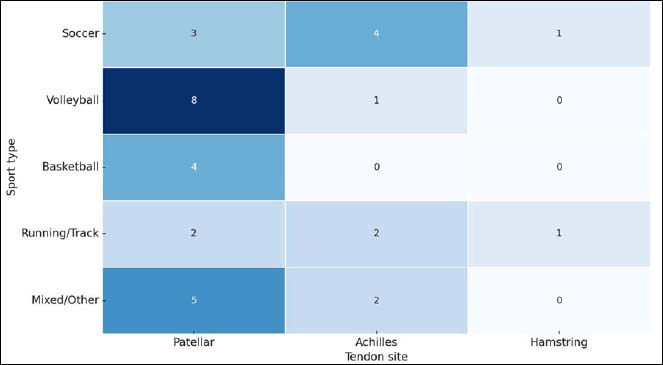
Figure 3.
Heatmap illustrating how often each tendon site is studied in athletes from various sports, with color intensity representing the number of cases.