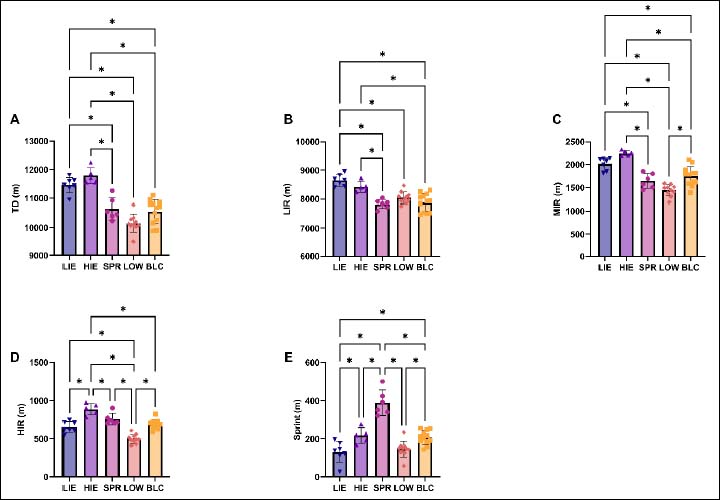
Figure 4. The average match-specific running performance across the five identified physiological clusters. Each data point corresponds to the average match performance, in meters covered, of a young elite soccer player over two full seasons, with mean and standard deviation presented. The clusters are denoted by their characteristics: LIE (low intensity endurance), HIE (high intensity endurance), SPR (sprint), LOW (low endurance and sprint), and BLC (balanced). The comparison of these groups (LIE: n = 7, HIE: n = 5, SPR: n = 6, LOW: n = 10, BLC: n = 12) is depicted for A) total distance covered, B) distance covered at low intensity (<14 km/h), C) distance covered at moderate intensity (≥14 and <19 km/h), D) distance covered at high intensity (≥19 and <24 km/h), and E) distance covered while sprinting (≥24 km/h). Significance is indicated (* P < 0.05) and determined by one-way ANOVA with Bonferroni correction.