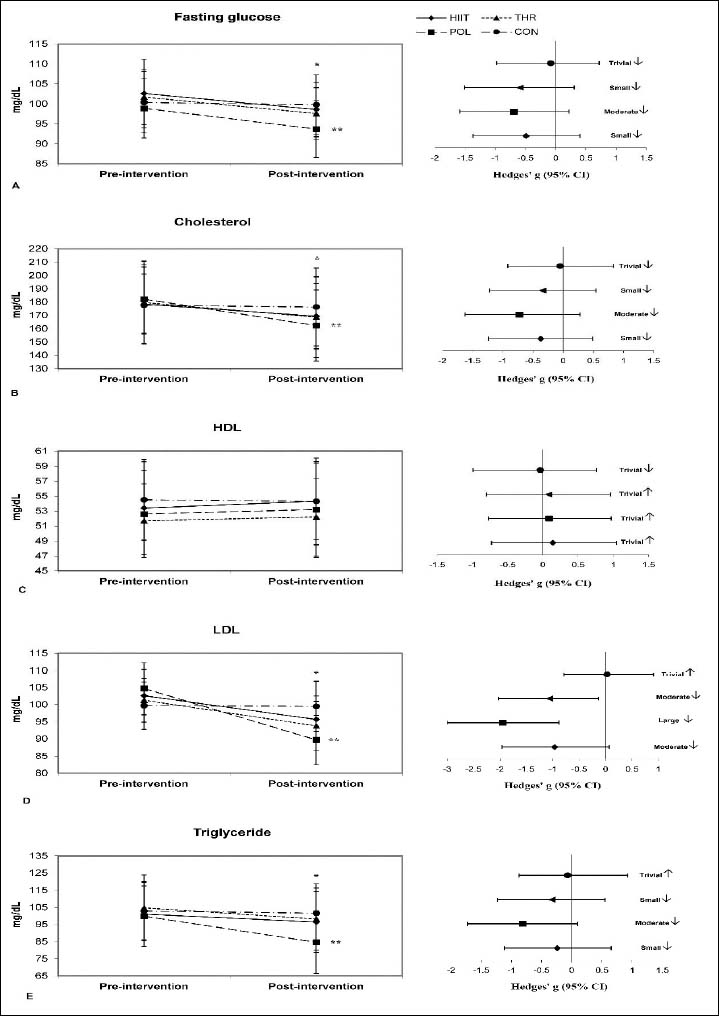
Figure 4. Changes in glucose and lipid profiles from pre to post-intervention. *significant differences compared with the pre-training for all the training groups. **significant differences between the POL vs. HIIT and THR training groups following the intervention period.