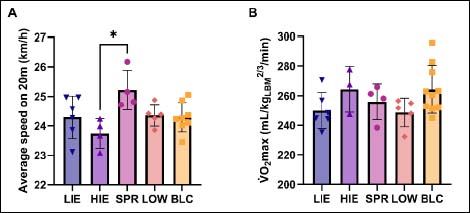
Figure 5. Average 20-meter sprint speed and V̇O2max, normalized to lean body mass2/3, per playing position. Each data point represents individually obtained values of male young elite soccer players. A) The means and standard deviations for average sprint speed are shown for LIE (n = 6), HIE (n = 4), SPR (n = 4), LOW (n = 5), and BLC (n = 8). B) The means and standard deviations of normalized V̇O2max are shown for LIE (n = 6), HIE (n = 3), SPR (n = 4), LOW (n = 5) and BLC (n = 10). Significance is indicated (* P < 0.05) and determined by one-way ANOVA with Bonferroni correction. There were no significant differences between the five different clusters for endurance capacity (P = 0.241). However, on the 20-meter sprint, the average speed of SPR was 1.5 km/h faster than HIE (25.22 vs 23.75, P = 0. 012).