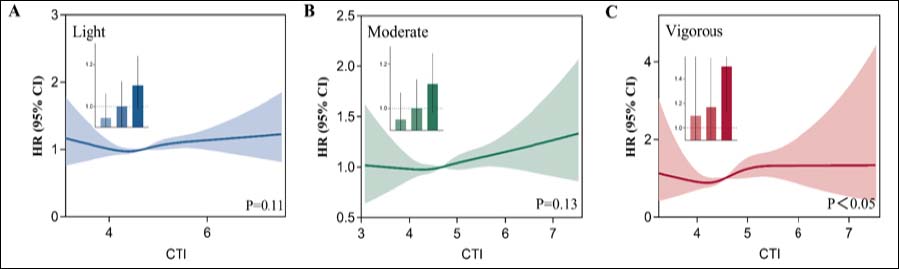
Figure 5. Restricted cubic spline analyses of the association between the C-reactive protein - triglyceride-glucose index (CTI) and risk of dyslipidemia in participants with light physical activity (A), moderate physical activity (B), and vigorous physical activity (C).