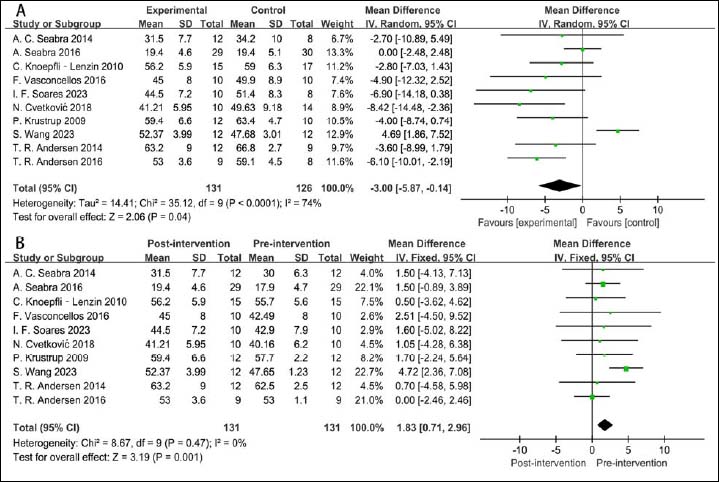
Figure 5.
Forest plots of (A) the between-group comparison for LBM and (B) the within-group pre–post analysis of LBM following football intervention.