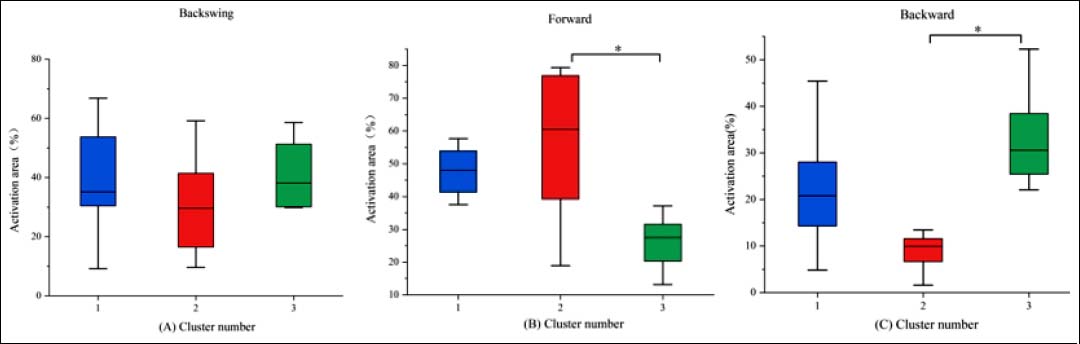
Figure 11.
The percentage distribution of total activation areas among the three clusters during the three phases of the stroke. *p < 0.05, **p < 0.01.