Figure
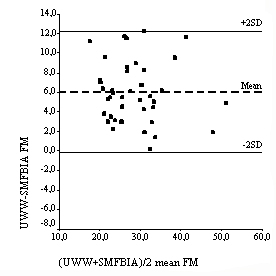
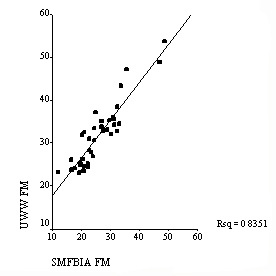
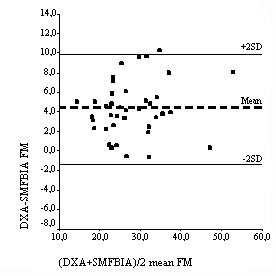
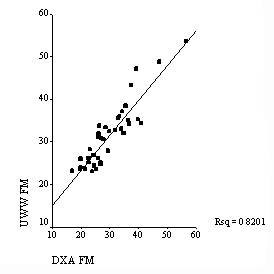
10.
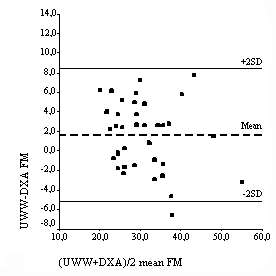
Pearson correlation coefficient and Bland-Altman analysis plotted from FM between all methods.