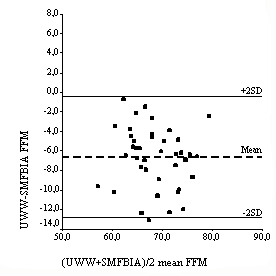
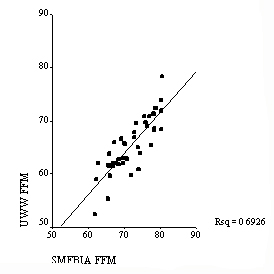
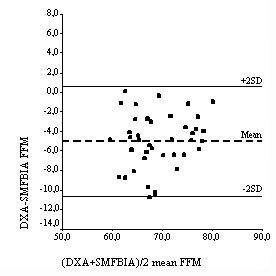
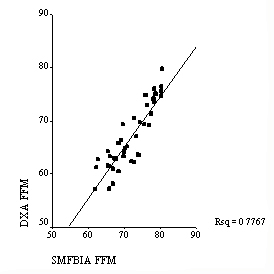
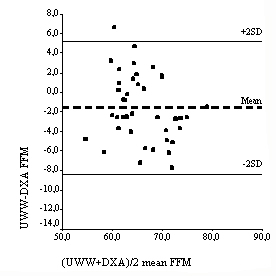
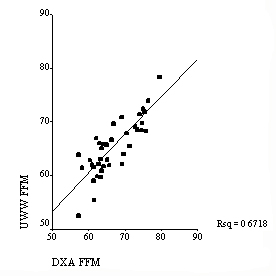
Figure
11
. Pearson correlation coefficient and Bland-Altman analysis plotted from FMM between all methods.