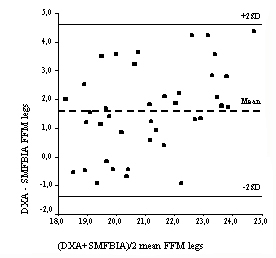
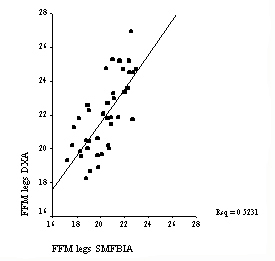
Figure
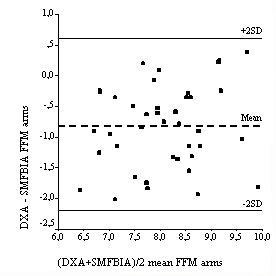
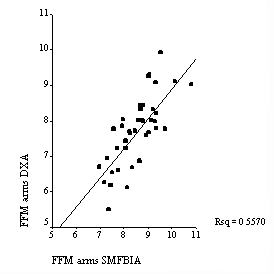
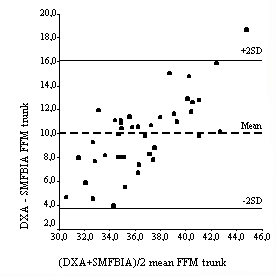
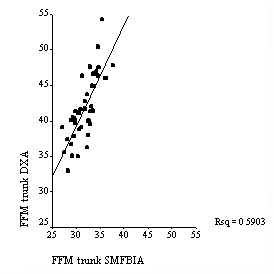
12.
Pearson correlation coefficient and Bland-Altman analysis plotted from segmental FFM between DXA and SMFBIA.