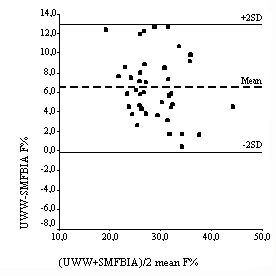
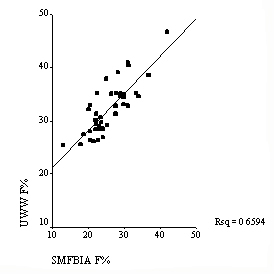
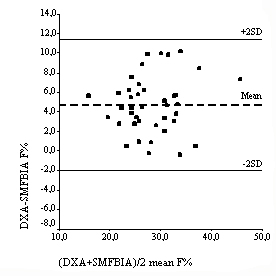
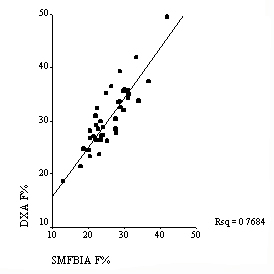
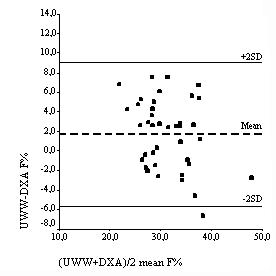
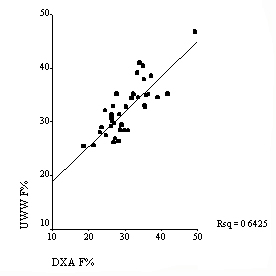
Figure
9.
Pearson correlation coefficient and Bland-Altman analysis plotted from F% between all methods.
Ā