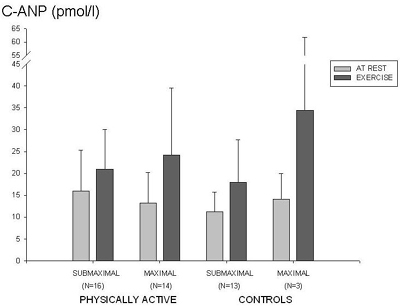
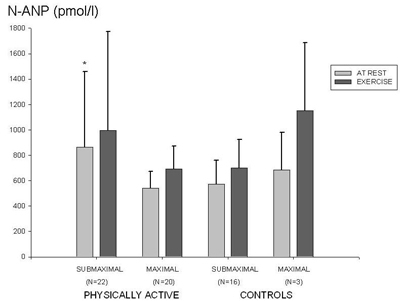
| Figure 4. a) The plasma concentration of C-ANP at rest and after submaximal and maximal exercise (exercise) among two groups of elderly women (Study 1), b) The plasma concentration of N-ANP at rest and after submaximal and maximal exercise (exercise) among two groups of elderly women (Study 1). *Significant difference compared with the resting values of physically active maximal and control submaximal (p < 0.05). |