|
|
|
| |
| ABSTRACT |
|
Although differences between training and competitive contexts in table tennis are widely recognized, empirical evidence quantifying these differences remains limited. This study compared the technical-tactical characteristics of 40 training matches and 40 international competitions among Chinese National Youth Team U15 female players to provide evidence for training optimization. A mixed-method approach combining heat map visualization and Generalized Estimating Equations (GEE) was used to examine contextual differences and identify key factors associated with match-winning probability. Results showed that training and international matches exhibited similar individual technical-tactical indicators but differed substantially in placement-technique combinations and the influence of stroke sequences on winning probability. Training matches emphasized control of short areas, whereas international competitions showed greater use of backhand long-area attacks to initiate offensive play. In addition, early strokes were more influential in training matches, while later strokes played a greater role in international competitions. These findings indicate that current training matches may not fully replicate international competitive demands. Training should therefore enhance rally-transition tactics, offensive initiation, and competitive simulation to improve transferability to international competition. |
| Key words:
Table tennis, training match, international competitions, technical and tactical analysis
|
Key
Points
- Training and international matches differed mainly in placement-technique combinations.
- Training emphasized short-area control and early strokes, while international competition relied more on backhand long-area attacks and later strokes.
- Training should strengthen offensive initiation, rally transitions, and competition simulation.
|
The ultimate goal of sports training is to enhance competitive performance and achieve success in official competitions (Smith, 2003). Lames (2023) further asserts that success in competition is the ultimate criterion for every action taken in training. Therefore, systematically comparing technical and tactical execution between training and competition contexts is crucial for evaluating training effectiveness, identifying gaps between training and actual performance, and optimizing long-term player development. Technical and tactical behavior is central to table tennis performance (Tang, 2009). Traditional match analysis has relied heavily on coaches’ experiential judgments, which are often limited by real-time observation capacity and subject to bias. To overcome these limitations, objective data-driven methods have gained increasing attention (Zhang, 2004; Djokic et al., 2016). Early quantitative research in table tennis was strongly influenced by the three-phase evaluation method proposed by Wu et al. (1988), which divides rallies into attack after service, attack after receiving, and stalemate phases, and evaluates performance using scoring rate and usage rate. This framework laid the methodological foundation for subsequent research and has been widely applied in Chinese table tennis studies (Xu et al., 2014; Zhang and Yang, 2016; Xu, 2019). Follow-up studies have further refined phase-based models, including the four-phase, double three-phase, and dynamic three-phase methods (Yang and Zhang, 2014; Xiao et al., 2018; Zhang et al., 2018), thereby improving the precision of technical-tactical identification, especially for transitional shots such as the fifth stroke (Wu et al., 2014; Xu et al., 2019). Although these phase-based models effectively describe player performance across different rally stages, they treat each stage independently and fail to reveal the differential effects of stroke sequences-a key limitation that the present study addresses through stroke-by-stroke analysis. With advances in data collection and computing technology, table tennis research has gradually shifted from descriptive statistics to modeling competitive performance. Zhang et al., (2013; 2015) proposed a technique effectiveness evaluation method by integrating scoring rate and usage rate. Tamaki et al. (2017) further extended this approach by incorporating shot number, scoring rate, and losing rate to develop an effectiveness algorithm for evaluating stroke performance. Based on these developments, Zhou and Zhang (2022) proposed a tactical benefit algorithm that combines tactical frequency and scoring rate to quantify the benefits of different tactical combinations and evaluate their relative effectiveness in table tennis matches. These algorithms provide a quantitative assessment of stroke effectiveness but do not capture the structural relationships among multiple techniques and match outcomes. Multivariate studies have filled this gap by applying methods such as multiple regression, BP neural networks, and path analysis to identify key technical indicators influencing match results and to establish nonlinear and mediating pathway models (Yang and Zhang, 2016; Zhou and Zhang, 2023). These approaches demonstrate that elite performance arises not from isolated actions but from complex interdependencies, highlighting the importance of constructing interaction-based structural models in performance analysis. Stochastic modeling approaches have also contributed to theoretical advancements in racket sports analysis. The Markov chain model, first introduced to tennis by Lames (1991), was subsequently adapted to table tennis to evaluate the contribution of different match actions to competitive outcomes (Zhang and Hohmann, 2004; 2005; Pfeiffer et al., 2010). Later refinements by Wenninger and Lames (2016) improved model structure and estimation methods, while recent work further explored differences in offensive priority and tactical decision-making between male and female players (Rothe et al., 2025). These approaches provide a probabilistic framework for understanding performance dynamics in match play. However, they only offer indirect inference of action importance via simulation, rather than directly estimating the marginal contribution of each stroke to winning probability. In contrast, the present study directly estimates the actual effects of each stroke and technique, without relying on hypothetical simulation assumptions. A systematic review by Fuchs et al. (2018) synthesizes the above methodological advances and highlights an important distinction: theoretical match analysis aims to explain the structural logic of performance, whereas applied match analysis aims to guide coaching practice. This distinction underscores that research should not only identify performance patterns but also examine whether training environments replicate the structural demands of competition. Despite these methodological advances, comparative analyses between training and competition have focused primarily on physiological and load-related variables, with limited attention given to technical-tactical performance structures. Studies on rugby, soccer, volleyball, and handball consistently show that training fails to replicate the intensity, emotional arousal, and tactical pressure of official competitions (Gabbett, 2004; Owen et al., 2017; Altundag et al., 2022; Nikolovski et al., 2023). In racket sports, Murphy et al. (2016) demonstrated that both technical density and psychological demands are lower in training and simulated matches than in official events. However, comparative evidence based on technical-tactical performance indicators, especially for elite youth table tennis players, remains scarce. No study has systematically compared training matches with international competitions in terms of technical-tactical usage. In summary, previous studies have substantially advanced table tennis performance analysis through phase-based evaluation, effectiveness modeling, regression analysis, BP neural networks, and Markov chain methods. However, many of these approaches share a methodological limitation: they often treat multiple matches from the same player as independent observations, overlooking the repeated-measures structure of the data. This practice may lead to underestimated standard errors and inflated Type I error rates. To address this issue, the present study applies generalized estimating equations (GEE), which account for within-subject correlations and provide more robust statistical inferences. More importantly, comparative research examining technical-tactical structures between training and competition remains limited. It is still unclear whether the patterns observed in training matches accurately represent those encountered in international competitions. Addressing this gap is essential for evaluating the competition specificity of current training practices. Therefore, this study systematically compares the technical-tactical characteristics of elite youth table tennis players across training and international competition contexts. We hypothesize that significant differences exist in both key indicators and performance structures, revealing potential limitations in current training design. Match SampleThis study selected 80 matches involving five elite U15 female players from the Chinese National Youth Team in 2024 as the sample, including 40 training matches (20 wins, 20 losses) and 40 international competitions (20 wins, 20 losses). They were ranked 2nd, 3rd, 4th, 9th, and 25th, respectively, in the ITTF U15 Girls' World Rankings on June 4, 2024. The mean age, height, and body weight of the five female players were 14.56 ± 0.62 years, 162.6 ± 0.05 cm, and 56.8 ± 6.69 kg, respectively. All players adopted a shakehand offensive playing style, with four being right-handed and one left-handed (the players’ stroke techniques and ball placement were recorded according to forehand and backhand strokes; therefore, data from right- and left-handed players could be pooled and analyzed together). The 40 training matches primarily involved the aforementioned five national youth team players competing against other team players or each other. The 40 international competitions were official matches where these five players competed against players from countries including South Korea, France, Australia, India, Portugal, Slovenia, Ukraine, Singapore, Kazakhstan, Poland, and regions such as Chinese Taipei and Hong Kong, China. All matches were conducted in a best-of-five format. To control for the potential influence of match outcomes on technical and tactical behavior, the numbers of winning and losing matches and games were matched between the training matches and the international competitions (Table 1). The data used in this study were obtained from semi-public training matches and official World Table Tennis broadcasts. Training match videos were routinely recorded by coaches and players as part of the standard training process and later used for performance analysis with authorization from team management. Training matches were commonly observed by team managers, invited referees, training-base staff, and local youth players. As all participants were underage players, informed consent was obtained from both the players and their legal guardians, and approval for data use was granted by the coaching staff. All data were fully anonymized and included only match-related technical and tactical variables without any personal identifiers. The study involved retrospective analysis of non-identifiable observational data from routine training and publicly available matches, with no intervention or direct interaction with participants; therefore, in accordance with institutional ethical guidelines, formal ethical approval was not required.
Performance indicatorsThe performance indicators in this study were of four types: stroke sequence, stroke technique, ball placement and rally outcome, as shown in Table 2 and Figure 1. In table tennis, the first four strokes of a rally exhibit the greatest technical and tactical variability and carry the highest tactical significance (Zhang et al., 2013). Accordingly, this study analyzed the initial four strokes on a stroke-by-stroke basis. To facilitate systematic analysis beyond this phase, all odd-numbered strokes after the third stroke were grouped into a single category (denoted as S>3), and all even-numbered strokes after the fourth stroke were grouped into another category (denoted as S>4). A standardized stroke sequence was then established based on the order of ball contact within each rally. This categorization enhances both the comparability and generalizability of the data. Stroke technique indicators were recorded in accordance with established observational frameworks from previous research (Zhang and Hohmann, 2004; Molodzoff, 2008; Lanzoni et al., 2014; Zhang and Zhou, 2017; Zhou and Zhang, 2022). The techniques were classified as follows:
- The serve is the first stroke initiating each rally.
- The topspin/attack (TA) was originally considered two distinct techniques in table tennis. Topspin refers to an offensive technique that generates heavy topspin through frictional contact, whereas attack refers to a fast offensive technique based primarily on impact. However, with the development of table tennis techniques, elite players increasingly integrate friction and impact within a single offensive action (Zhang and Zhou, 2017). Therefore, the present study adopted Topspin/attack as a combined technical indicator.
- The smash is a high-speed offensive stroke intended to finish the point.
- The flick is an attacking stroke typically executed close to the net.
- The twist is a backhand-dominant attacking stroke played near the net with pronounced spin.
- The backhand punch is an offensive stroke commonly associated with players using short-pimpled rubber.
- The push is a control-oriented stroke directed toward the opponent’s half-long or long placement.
- The touch short is a control-oriented stroke aimed at short placement on the opponent’s side.
- The block is a defensive stroke used to return an opponent’s topspin.
- The special category includes lob, chop, slice, pimpled-rubber techniques, and strokes that cannot be clearly identified. These techniques occur infrequently in competition and were therefore excluded from subsequent analyses.
Ball placement variables shown in Figure 1 were recorded following established procedures in the literature (Zhang and Hohmann, 2004; Molodzoff, 2008; Lanzoni et al., 2014; Zhang and Zhou, 2017; Zhou and Zhang, 2022). Rally outcomes were classified into two categories:
- Scoring occurs when the ball lands successfully on the opponent’s court and is not returned.
- Losing occurs when an error is made on the stroke, resulting in the ball landing out of bounds or in the net.
The objectivity of all observational indicators was ensured by using a previously validated coding system developed by Zhang and Zhou (2017). In that study, inter-rater reliability was assessed using Cohen’s kappa statistics based on the same dataset and observational framework, and excellent agreement was reported (kappa = 0.995 for stroke technique, 0.992 for ball placement, and 1.000 for rally outcomes). Given that the present study adopted the same standardized observation system and coding protocol, the reliability evidence reported by Zhang and Zhou (2017) was used as methodological support for the current analysis.
Scoring rate, usage rate, and technique effectiveness formulasScoring and usage rates for the first four strokes (S1-S4): The scoring rate of the i-th stroke in the first four strokes is calculated as the number of points won on that stroke divided by the total number of that stroke played, as shown in Formula 1 (i = 1, 2, 3, 4):
 |
|
(1) |
The usage rate of the i-th stroke in the first four strokes is calculated as the proportion of that stroke among all strokes in the match, as shown in Formula 2 (i = 1, 2, 3, 4).
 |
|
(2) |
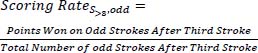
Scoring and usage rates for odd-numbered strokes after the third stroke in the service sequence (S>3, odd): This scoring rate represents the points won on all odd-numbered strokes after the third stroke of the service sequence divided by the total number of those strokes, as shown in Formula 3.
 |
|
(3) |
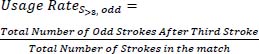
This usage rate is the proportion of odd-numbered strokes after the third stroke in the service sequence among all strokes in the match, as shown in Formula 4.
 |
|
(4) |
Scoring and usage rates for even-numbered strokes after the fourth stroke in the receive sequence (S>4, even): This scoring rate represents the points won on all even-numbered strokes after the fourth stroke of the receive sequence divided by the total number of those strokes, as shown in Formula 5.
 |
|
(5) |
This usage rate is the proportion of even-numbered strokes after the fourth stroke in the receive sequence among all strokes in the match, as shown in Formula (6).
 |
|
(6) |
Formulas for calculating technique scoring rate and usage rate: Scoring Rate of stroke technique i (Formula 7):
 |
|
(7) |
where Si,m represents the number of points scored using technique i in match m, and Ni,m represents the total number of times technique i was used in match m.
Usage Rate of stroke technique i (Formula 8):
 |
|
(8) |
where Nm denotes the total number of strokes in match m.
Formula for stroke effectiveness: This study employed the technique effectiveness (TE) formula (Formula 9), based on scoring rate (SR) and usage rate (UR), as proposed by Zhang et al. (2013):
 |
|
(9) |
Statistical analysis of scoring rate, usage rate and effectiveness: For each stroke and technical indicator (scoring rate, usage rate, effectiveness), means ± SD were calculated for training matches and international competitions. To compare the differences between the two match types while controlling for within-subject correlation due to repeated measurements, a generalized estimating equation (Zeger and Liang, 1986) with identity link function (for continuous outcomes), exchangeable working correlation matrix, and robust covariance estimator was used (fixed factor: match type; subject variable: athlete ID), as shown in Formula 10. Regression coefficient (β), standard error (SE), 95% CI, and p value were obtained. Significance level α = 0.05. No post hoc correction was needed for two group comparisons. All analyses were based on complete case data. SPSS 27.0 was used.
 |
|
(10) |
Yij outcome (scoring rate / usage rate / effectiveness) for the i-th athlete at the j-th observation
Match Typeij: training match = 1, international competition = 0
β0: estimated mean for international competitions
β1: mean difference between training and international matches
Heat map analysisHeat map algorithm
Data were collected on players’ ball placement distribution during the first four strokes, after the third stroke, and after the fourth stroke, as well as on the corresponding technical usage of each stroke by the opponents, thereby forming a “placement→technique” combination. The matrix calculation (Formula 11) is as follows:
 |
|
(11) |
where aij represents the number of times the j-th combination was used in the 40 matches for the i-th stroke.
Statistical analysis of “placement→technique” combinations: A generalized estimating equation (GEE) model was used to examine differences in the usage of “placement→technique” combinations. As all data were count data, a Poisson GEE model with a log link (McCullagh and Nelder, 1989) was employed to account for their discrete distribution. GEE was selected to handle intra‐cluster correlation among multiple matches from the same player (Zeger and Liang, 1986). To account for differences in the number of stroke-level opportunities across matches and rally stages, the logarithm of the total number of opportunities (total_strokes) was included as an offset. This specification allowed comparison of usage rates per stroke opportunity rather than raw frequencies (Frome and Checkoway, 1985). The model specification is given in Formula 12:
 |
|
(12) |
Where: Yij denotes the frequency of the j-th combination (placement→technique) within the i-th stroke of the match.
E[Yij] represents the expected value of Yij given the predictor variables. GEE targets the marginal expectation (population‐averaged level), not subject‐specific expectations.
log(.) denotes the log link function. For count data (Poisson, non‐negative), it ensures fitted expectations are positive and converts multiplicative to additive relationships, easing linear modeling.
total_strokesij represents the total number of opportunities / total strokes (exposure) for all combinations at the i-th stroke in a match. It quantifies the total count of opportunities for the combination to occur.
Training matchij is a binary indicator variable (training match = 1, international competition = 0). This coding allows the regression coefficient β1 to directly reflect the effect of a training match compared to an international competition.
β0 denotes the intercept, which corresponds to the mean log usage rate under the condition that Training match = 0 (international competition).
β1 is the regression coefficient for training matches, representing the offset‐adjusted average difference in log usage rate between training and international competitions. A positive β1 means training matches have a higher usage rate; a negative β1 means a lower rate.
Role of the offset: Directly comparing frequencies is confounded by total strokes-more strokes lead to higher observed frequencies. The objective is the usage rate per unit opportunity (incidence rate). Therefore, total opportunities are included as an offset (coefficient fixed at 1), modeling the log incidence rate and eliminating confounding by varying total opportunity counts across matches. P values were adjusted for multiple testing across technique categories within each phase using the Benjamini-Hochberg FDR method (Benjamini and Hochberg, 1995). Statistical significance was set at FDR-adjusted p value < 0.05. Usage rate, regression coefficient (β), rate ratio (RR), and adjusted p value were presented in the Results section. Analyses were conducted using Python 3.8.0.
Generalized estimating equations regression modelsRegression model for match winning probability based on stroke sequence: This study investigated the effect of technical effectiveness in different stroke sequences on match winning probability (WP). WP is a continuous variable calculated as points won / (points won + points lost), ranging in [0, 1]. Because multiple repeated observations from the same athlete induce intra‐cluster correlation, ignoring it would bias standard error estimation. Therefore, generalized estimating equations (GEEs) were used. GEE characterizes the correlation structure among observations within a cluster by specifying a working correlation matrix, thereby yielding robust standard errors (Ballinger, 2004). Dependent variable: WP (continuous variable) Independent variables: stroke effectiveness of each stroke Cluster: athlete ID Link function and distribution: identity link, Gaussian distribution Working correlation structure: exchangeable (assumes constant correlation between residuals of any two matches from the same athlete) The resulting marginal model is given in Formula 13:
 |
|
(13) |
Where WPij is the winning probability of the j-th match for the i-th athlete; β0 is the intercept; β1 through β6 are regression coefficients, interpreted as the marginal change in average WP for a one‐unit increase in the corresponding stroke‐sequence effectiveness, holding other stroke‐sequence effectiveness and within‐athlete correlation constant.
Regression model for match winning probability based on stroke technique: To investigate the marginal effects of the effectiveness of nine core stroke techniques on match winning probability, this study constructed a multiple regression model using Generalized Estimating Equations (GEE) to account for non‐independence among multiple matches from the same athlete. Dependent variable: winning probability (continuous) Independent variables: stroke technique effectiveness Cluster: athlete ID Link function and distribution: identity link, Gaussian distribution Working correlation structure: exchangeable The full GEE marginal model was specified as follows (Formula 14):
 |
|
(14) |
where WPij is the winning probability of the j-th match for the i-th athlete; β0 is the intercept; β1 through β9 are regression coefficients representing the marginal change in average winning probability per one‐unit increase in the corresponding technique effectiveness, holding other effectiveness and within‐athlete correlation constant.
All regression analyses were performed using SPSS 27.0 with robust covariance estimation and an exchangeable working correlation matrix; coefficient estimates, 95% confidence intervals, and p values are reported for all nine predictors.
Analysis of scoring rate, usage rate, and technical effectivenessStroke sequence: Table 3 compares the scoring rate, usage rate, and technical effectiveness of each stroke sequence in training matches (TM) and international competitions (IC). GEE analysis showed for the fourth stroke, both scoring and usage rates were significantly higher in TM. Specifically, the fourth-stroke scoring rate in TM (0.229 ± 0.093) was higher than in IC (0.205 ± 0.076) (β = 0.027, p < 0.001, 95% CI [0.011, 0.043]), an increase of approximately 2.4 percentage points. The usage rate of the fourth stroke was also higher in TM (0.139 ± 0.014) than in IC (0.133 ± 0.016) (β = 0.006, p = 0.027, 95% CI [0.001, 0.011]), a difference of approximately 0.6 percentage points. No significant differences in effectiveness were found for any stroke sequence. Stroke technique: Table 4 presents GEE results for technical indicators. Significant between-group differences were found for three techniques. For usage rate, touch short was higher in TM (0.080 ± 0.042 vs. 0.038 ± 0.025; β = 0.041, p = 0.004, 95% CI [0.013, 0.070]), a mean difference of 4.2 percentage points. Flick usage was also higher in TM (0.027 ± 0.020 vs. 0.013 ± 0.014; β = 0.013, p = 0.043, 95% CI [0.000, 0.026]), corresponding to an absolute difference of 1.4 percentage points. For effectiveness, TM showed lower values for flick (0.499 ± 0.012 vs. 0.501 ± 0.008; β = -0.002, p = 0.017, 95% CI [-0.004, 0.000]) and block (0.480 ± 0.015 vs. 0.484 ± 0.015; β = -0.004, p = 0.026, 95% CI [-0.008, -0.001]), reductions of 0.2 and 0.4 percentage points, respectively.
Heat map analysis of “placement→technique” combinationsFigure 2 and Figure 3 show the differences in usage rates of ball placement and stroke technique combinations between TM and IC for the serve round and receive round, respectively. The vertical axis represents nine ball placements, and the horizontal axis represents nine stroke techniques. Yellow represents the combination matrix of the target player’s ball placement and the opponent’s used technique. Green represents the transition matrix (opponent’s ball placement and the target player’s technique combination). As shown in Figure 2, compared with IC, in TM: for the first stroke, three combinations showed significantly higher usage rates: sm→TS (TM: 16.3%, IC: 9.4%; β = 0.053, RR = 1.738, adjusted p < 0.001), sf→FL (TM: 2.8%, IC: 0.8%; β = 1.175, RR = 3.238, adjusted p < 0.001), and sm→FL (TM: 4.7%, IC: 2.5%; β = 0.604, RR = 1.829, adjusted p < 0.01). For the third stroke, two combinations showed higher usage rates: sm→TS (TM: 2.2%, IC: 0.7%; β = 1.555, RR = 3.175, adjusted p < 0.001) and hlm→TA (TM: 3.1%, IC: 1%; β = 1.114, RR = 3.046, adjusted p < 0.01). For the first stroke, IC showed higher usage rates than TM in four combinations: sf→TW (IC: 1.8%, TM: 0.4%; β = -1.536, RR = 0.215, adjusted p < 0.001), lm→TA (IC: 13.4%, TM: 8.7%; β = -0.459, RR = 0.632, adjusted p < 0.01), lb→TA (IC: 7.3%, TM: 4.7%; β = -0.464, RR = 0.629, adjusted p < 0.001), and lb→PU (IC: 0.7%, TM: 0.3%; β = -0.914, RR = 0.401, adjusted p < 0.05). For the third stroke, the combination lm→BL (IC: 10.8%, TM: 6.5%; β = -0.492, RR = 0.612, adjusted p < 0.01) showed significantly higher usage rates in IC than in TM. From Figure 3, compared to IC, TM had higher usage rates for the following combinations: second stroke hlf→TA (TM: 2.5%, IC: 1.3%; β = 0.674, RR = 1.963, adjusted p < 0.001), sm→TS (TM: 6%, IC: 1.5%; β = 1.34, RR = 3.819, adjusted p < 0.001), sf→TS (TM: 1.3%, IC: 0.6%; β = 0.775, RR = 2.170, adjusted p < 0.001), and sf→PU (TM: 2.5%, IC: 0.8%; β = 1.069, RR = 2.913, adjusted p < 0.001). one combination in the fourth stroke: lf→TA (TM: 22.8%, IC: 16.4%; β = 0.325, RR = 1.384, adjusted p < 0.001). and the combination lb + BL after the fourth stroke (TM: 4.4%, IC: 1.1%; β = 1.403, RR = 4.067, adjusted p < 0.001). Conversely, IC had higher usage rates for the second stroke combinations lm→BL (IC: 2.4%, TM: 0.8%; β = -1.151, RR = 0.316, adjusted p < 0.01), lb→TA (IC: 32.4%, TM: 25%; β = -0.268, RR = 0.765, adjusted p < 0.001), and lm→TA (IC: 29.4%, TM: 25.2%; β = -0.156, RR = 0.856, adjusted p < 0.05). the fourth stroke combination lm→BL (IC: 5%, TM: 2.6%; β = -0.524, RR = 0.592, adjusted p < 0.05), and the combination lb→TA (IC: 31.4%, TM: 23.6%; β = -0.286, RR = 0.751, adjusted p < 0.05) after the fourth stroke. As shown in Figure 2 and Figure 3, a total of 21 combinations showed statistical significance between TM and IC. However, a methodological detail warrants special attention. Specifically, data distributions were extremely imbalanced for the following 14 combinations: one combination in the first stroke (lm→BL); six combinations in the third stroke (lm→SM, hlb→TA, hlf→TA, sf→PU, hlm→FL, sb→PU); two combinations in the second stroke (hlm→SM, hlf →TS); two combinations in the fourth stroke (lb→SM, sf→TS); and three combinations in the fourth stroke and beyond (sf→FL, sf→TS, lf→SM). Specifically, for these 14 combinations, all observations in IC were zero. These 14 combinations were not practically meaningful and thus are not displayed in the figures; however, their existence in the dataset reveals a pattern of data sparsity. Although the generalized estimating equation (GEE) yielded statistically significant test results (adjusted p < 0.05) based on this data pattern, there were cells with zero events in any comparison group. This situation is defined as “complete separation”, for which the statistical estimation is invalid (Heinze and Schemper, 2002). Therefore, considering the data sparsity issue of these 14 combinations, the remaining 21 significant combinations retain practical observational meaning. The main conclusions of this study will focus on those variables with more balanced data distribution and more robust results.
Generalized estimating equations regression analysisAnalysis of the model relating stroke sequence effectiveness to match winning probability
Table 5 presents the GEE model (QIC = 16.423, QICC = 14.037) for the effect of stroke sequence effectiveness on winning probability in TM. All regression coefficients for S1, S2, S3, and S4 were positive and significant (p < 0.001). S3 had the strongest effect (β = 1.741, 95% CI [1.303, 2.178]), followed by S4 (β = 1.702, 95% CI [1.056, 2.347]) and S2 (β = 1.680, 95% CI [1.137, 2.224]). S1 had a smaller but significant effect (β = 0.708, 95% CI [0.297, 1.119]). Table 6 presents the GEE model of stroke sequence effectiveness on winning probability in IC (QIC = 13.617, QICC = 14.049). All coefficients for S1, S2, S3, S4 and S>3 were positive and significant (p < 0.05). S>3 had the strongest effect (β = 3.403, p < 0.001, 95% CI [2.896, 3.910]), followed by S4 (β = 1.568, p < 0.001, 95% CI [0.884, 2.251]) and S3 (β = 1.493, p < 0.001, 95% CI [1.245, 1.740]). S1 (β = 0.807, p = .040, 95% CI [0.035, 1.578]) and S2 (β = 0.714, p < 0.001, 95% CI [0.292, 1.135]) had smaller but significant effects.
Analysis of the model relating technique effectiveness to match winning probabilityTable 7 presents the GEE model of stroke technique effectiveness on winning probability in TM (QIC = 11.232, QICC = 20.032). All coefficients for PU, TS, SV, and TA were positive and significant (p < 0.01). PU had the strongest effect (β = 1.143, p = 0.006, 95% CI [0.335, 1.952]), followed by TS (β = 1.104, p < 0.001, 95% CI [0.762, 1.446]) and SV (β = 0.954, p < 0.001, 95% CI [0.566, 1.341]). TA had a smaller but significant effect (β = 0.352, p < 0.001, 95% CI [0.221, 0.483]). Table 8 presents the GEE model of stroke technique effectiveness on winning probability in IC (QIC = 15.338, QICC = 20.035). SV, PU, TA, BP had significant coefficients (p < 0.05). SV had the largest effect (β = 1.206, p < 0.001, 95% CI [0.794, 1.617]), followed by PU (β = 0.990, p < 0.001, 95% CI [0.471, 1.509]) and TA (β = 0.468, p < 0.001, 95% CI [0.233, 0.702]). BP also reached significance (β = 0.209, p = 0.032, 95% CI [0.018, 0.401]).
This study examined the contextual characteristics of technical and tactical behaviors in training matches versus international competitions among elite Chinese U15 female table tennis players. The results show that the differences between the two contexts are not mainly reflected in isolated technical indicators, but rather in the functional organization of stroke sequences, tactical combinations, and their contribution to match wins. This finding has direct practical implications for training: training design should shift from repetitive isolated technique practice to targeted simulation of competitive demands, placement preferences, and rally structures. This interpretation is consistent with the theoretical framework of table tennis performance analysis, which emphasizes the interaction among technical execution, tactical intention, and contextual constraints (Fuchs et al., 2018). Heat map analysis of “placement→technique”Heat map analysis identified clear differences in tactical organization across contexts. In training matches, players significantly prefer to hit the ball to the opponent’s middle and forehand short areas, limiting the opponent’s high-quality attacks and forcing conservative returns, thereby creating conditions for their own subsequent attacks. This finding is consistent with Lanzoni et al. (2014), who showed that serving to the middle short area can achieve good results. In contrast, in international competitions, players tend to hit the ball to the opponent’s backhand and middle long areas, leading to backhand-to-backhand rallies. This trend partially supports the conclusion of Zhang and Zhou (2017) that female players usually adopt relatively simple and stable tactical structures. It further indicates that both Chinese U15 female players and adult female players exhibit a preference for simple tactics, while the present study precisely identifies the specific form of this “stable structure”-namely, backhand long‐area rallies. This difference may be related to decision‐making under different competitive contexts. Although psychological pressure was not directly measured in this study, evidence shows that the psychological pressure in official matches is much higher than in training environments (Murphy et al., 2016). Therefore, psychological pressure may represent one possible factor influencing players’ tactical choices, although this interpretation requires further empirical validation. From a technical structure perspective, the forehand stroke is an open skill characterized by greater power, stronger spin, and higher stroke quality; the backhand stroke is a relatively closed skill with higher stability and controllability (Zhang et al., 2007). The backhand also has a faster execution speed and a smaller range of motion (Fuchs and Lames, 2021), which may contribute to its greater stability and controllability in fast-paced competitive situations.
Stroke sequence effectiveness and match winning probabilityThere is a systematic difference in the influence of stroke sequence on winning probability between the two competition contexts. In training matches, the technical-tactical effectiveness of strokes 1 to 4 is the most significant determinant of match outcomes. In contrast, in international competitions, the influence of strokes after the third stroke on winning probability is significantly stronger, and their importance exceeds that of the first four strokes. This result is highly consistent with the findings of Tamaki et al. (2017), which showed that Chinese female players excel in third‐stroke attacks and long rallies. However, the incremental contribution of the present study is that previous research largely remained at the level of describing the static characteristic of “high rally stability in elite female players” (Lanzoni et al., 2024), whereas this study, using a stroke‐sequence model, provides the first quantitative evidence that in international competitions, the stalemate phase (beyond the third stroke) has a statistically greater impact on winning probability than the first four strokes among Chinese U15 female players-and this effect is not significant in training matches. The shift from early active scoring in training to rally‐based decision‐making in matches likely reflects increased uncertainty and differences in tactical demands in official competitions.
Technique effectiveness and match winning probabilityAt the technical level, serve, push, and topspin/attack consistently contributed to match winning probability across contexts, confirming the central tactical role of serve initiative (Lanzoni et al., 2014). However, two techniques showed significant context-dependent effects. The touch short technique had a significant impact on winning probability in training matches. Possible reasons include that players are more familiar with each other in training matches, where the rhythm changes and placement control of touch short can effectively disrupt opponent's attacks. Additionally, the physical capacity and technical stability of young female players are still maturing, making control-oriented techniques more effective under lower-intensity conditions. In contrast, attacking techniques such as topspin/attack contributed more to match winning probability in international competitions than in training matches. Facing unfamiliar international competition environments and opponents’ playing styles, active attacking or quickly entering topspin rallies becomes a more stable scoring pathway-because unfamiliar opponents are less accustomed to one’s own stroke patterns, and the element of surprise in active attacks yields higher returns. At the same time, active attacking reduces the opponent’s reaction time and relieves one’s own defensive pressure. These findings are consistent with Lanzoni et al. (2024), who argued that tactical effectiveness depends on the interaction between playing style and contextual constraints. The present study further points out that the touch short, which performs well in training matches, no longer shows significant effectiveness in international competitions. If training content over-relies on such control techniques while neglecting attacking transition skills, athletes will lose effective scoring methods in international competition. Based on the above discussion, coaches and players should proactively simulate the competitive environment of international competitions in training (e.g., adding crowd noise, etc.) to help players adapt to the pace and competitive demands. When preparing for international competitions, youth training should appropriately increase the proportion of practice focused on proactively entering rallies from the backhand side, and should emphasize technical-tactical skills that facilitate a quick transition into rallies during the early service and receive phases. These include long serve tactics, receive-and-push followed by defensive counter-attacks, etc., thereby enhancing players’ tactical transition and adaptability in real matches.
Application and examplesThe heatmap results of this study show a clear difference in “placement→technique” combinations between training matches and international competitions: in international competitions, the rally combination in the backhand long area contributes more to winning probability. This finding can be directly applied to post‐match analysis-coaches and players can quickly identify winning patterns and tactical problems by examining “placement→technique” combinations on a heatmap. Take two international competitions between target player A and player B as an example. Player A lost the first match 2-3 but won the second 3-0. After the first match, a heatmap analysis of stroke “placement→technique” combinations were conducted to provide targeted recommendations for the player and coaching staff. Figure 4 shows the differences between the two matches in the serve‐and‐receive phase. The five combinations with the largest positive differences were: “lb→TA” after the fourth stroke; “lb→TA” on the second stroke; “lm→TA” on the fourth stroke; “lb→TA” on the third stroke; and “lb→TA” after the third stroke. The analysis shows that in the second match, player A significantly increased the frequency of placing the ball to the opponent’s middle and backhand long areas, thereby forcing the opponent to reply with topspin/attack and entering a backhand‐dominant rally rhythm. This supports the core conclusion of this paper: actively constructing a rally strategy in the backhand long area has a positive effect on match outcomes in international competitions. Therefore, it is recommended that players specifically strengthen their backhand stalemate ability in training, and use heatmaps after each international competition to quickly review their own “placement→technique” usage rates, enabling data‐driven tactical adjustments.
Selection of statistical methods for the studyThis study did not use traditional t-tests or nonparametric tests (e.g., Mann-Whitney U, Wilcoxon). Instead, it selected the generalized estimating equation (GEE) for the following reasons. First, the data structure is special. The data have repeated measures (multiple matches from the same athlete). Traditional tests require independent observations, but repeated data have intra-cluster correlation. Ignoring it leads to biased standard errors and increased Type I error. GEE captures this correlation via a working correlation matrix, yielding reliable estimates (Zeger and Liang, 1986). Second, the research goal matches GEE. This study aims to estimate the population-averaged effect of five athletes. GEE provides a population-average model (Gueorguieva, 2017). Its coefficients reflect changes in the population mean when covariates change. This interpretation is consistent with “between-group mean difference” in traditional tests, but GEE handles correlated data better. Compared to subject-specific models, GEE is more suitable for our population-effect question (Zeger et al.,1988). Third, GEE is robust. GEE is a semiparametric approach. It does not require specifying the full joint distribution of observations, only the marginal mean model. Even if the working correlation matrix (e.g., exchangeable structure) is misspecified, as long as the mean model is correct, the regression coefficients remain consistent. Moreover, the standard errors can be corrected using a robust sandwich variance estimator (Zeger et al.,1988; Hardin and Hilbe, 2002). This makes GEE results more trustworthy than tests relying on specific distributional assumptions. In summary, given the repeated-measures design and the need for population-effect inference, GEE better reflects the underlying data structure. Therefore, GEE was chosen as the main analytical method for this study.
LimitationsThe sample in this study was limited to Chinese U15 female players, and therefore the results may not be generalizable to other age groups or genders. Future research could expand the study population to include youth male players as well as elite adult male and female players, and could also incorporate comparisons of physical fitness and psychological factors. This would help make training matches more comparable to international competitions, thereby enhancing the effectiveness of training for elite table tennis players. Although training and formal competition are closely related in terms of performance objectives and technical demands, they constitute fundamentally different contextual environments, and multiple factors may influence players’ technical and tactical decision-making processes within them. First, individual differences in playing style may lead players to adopt different technical and tactical choices across contexts. Second, in training settings, players are typically familiar with their training partners, and such familiarity may alter tactical judgment and behavioral patterns. Third, compared with training environments, formal competition is generally associated with higher competitive intensity and may involve greater psychological demands; these contextual differences may further influence the use of technical and tactical actions and the underlying decision-making processes. Therefore, these potential influencing factors were not fully controlled or systematically addressed in the present study, which may impose certain limitations on the interpretation and generalizability of the findings. Additionally, a limitation of this study is that the GEE (Generalized Estimating Equations) analysis was based on only five clusters (K = 5). Since GEE relies on large-sample asymptotic properties, the limited number of clusters may reduce the reliability of standard error estimates and p-values and may affect Type I error control. Therefore, the statistical significance of the findings should be interpreted with caution. Future studies with a larger number of clusters are needed to further validate these findings. Another limitation is that the inter-rater reliability values reported for the observational coding system were derived from a previous validation study (Zhang and Zhou, 2017) rather than from the dataset newly coded in the present study. Although the current study adopted the same standardized coding framework, operational definitions, and observation protocol, reliability assessment based on the present dataset would provide stronger evidence for coding consistency. Further research should evaluate inter-rater reliability using newly collected datasets to confirm the robustness of the observational framework.
This study employed inferential statistics, heat map analysis, and generalized estimating equations to compare the technical and tactical applications of elite U15 female table tennis players in training matches and international competitions. The results indicate that, when the scoring rate, usage rate, and effectiveness of stroke sequence and stroke technique were examined as independent factors, the differences between training matches and international competitions were minimal. However, further analyses revealed substantial differences at more complex relational levels, including the combined use of ball placement and stroke technique, as well as the magnitude of the effects of stroke sequence and stroke technique on match-winning probability.
| ACKNOWLEDGEMENTS |
The datasets generated during the current study are not publicly available but are available from the corresponding author upon reasonable request. The authors declare that they have no conflict of interest. All experimental procedures were conducted in compliance with the relevant legal and ethical standards of the country where the study was carried out. The authors declare that no Generative AI or AI-assisted technologies were used in the writing of this manuscript. |
|
| AUTHOR BIOGRAPHY |
|
 |
Shuangying Wang |
| Employment: Department of Sports Science, College of Education, Zhejiang University |
| Degree: Master's Student |
| Research interests: Performance analysis in table tennis |
| E-mail: Shuangying.Wang@zju.edu.cn |
| |
 |
Hui Zhang |
| Employment: Department of Sports Science, College of Education, Zhejiang University |
| Degree: PhD |
| Research interests: Training science, performance analysis in sport |
| E-mail: zhang_hui@zju.edu.cn |
| |
|
| |
| REFERENCES |
 Altundag, E., Akyildiz, Z., Lima, R., Castro, H.O., Çene, E., Akaregsme, C., Miale, G., Clemente, F. M. (2022) Training load demands and match load demands in elite women volleyball players. Proceedings of the Institution of Mechanical Engineers, Part P: Journal of Sports Engineering and Technology 239, 98-107. Crossref |
Ballinger, G.A. (2004) Using generalized estimating equations for longitudinal data analysis. Organizational Research Methods 7, 127-150. Crossref |
Benjamini, Y., Hochberg, Y. (1995) Controlling the false discovery rate: A practical and powerful approach to multiple testing. Journal of the Royal Statistical Society: Series B (Methodological) 57, 289-300. Crossref |
Djokic, Z., Munivrana, G. and Levajac, D. (2016) Match analyses of the
final game of Men's World Championship 2014 – China vs. Germany. In: Kondrič, M., Zhang, X. and Xiao, D. (Eds.) Science
and Racket Sports V. Suzhou University Press, pp. 242-250. |
Frome, E.L., Checkoway, H. (1985) Use of Poisson regression models in estimating incidence rates and ratios. American Journal of Epidemiology 121, 309-323. Crossref |
Fuchs, M., Lames, M. (2021) First offensive shot in elite table tennis. International Journal of Racket Sports Science 3, 10-21. Crossref |
Fuchs, M., Liu, R., Lanzoni, I.M., Munivrana, G., Straub, G., Tamaki, S., Yoshida, K., Zhang, H., Lames, M. (2018) Table tennis match analysis: A review. Journal of Sports Sciences 36, 2653-2662. Crossref |
Gabbett, T.J. (2004) Influence of training and match intensity on injuries in rugby league. Journal of Sports Sciences 22, 409-417. Crossref |
Gueorguieva, R. (2017) Statistical Methods in Psychiatry and Related
Fields: Longitudinal, Clustered, and Other Repeated Measures
Data. Chapman and Hall/CRC. |
Hardin, J.W. and Hilbe, J.M. (2002) Generalized Estimating Equations.
Chapman and Hall/CRC, Boca Raton. Crossref |
Heinze, G., Schemper, M. (2002) A solution to the problem of separation in logistic regression. Statistics in Medicine 21, 2409-2419. Crossref |
Lames, M. (1991) Leistungsdiagnostik durch Computersimulation: Ein Beitrag zur Theorie der Sportspiele am Beispiel Tennis. Harri Deutsch. |
Lames, M. (2023) Performance Analysis in Game Sports: Concepts and Methods. Springer Nature. Crossref |
Lanzoni, I.M., Cortesi, M., Russo, G., Bankosz, Z., Winiarski, S., Bartolomei, S. (2024) Playing style of women and men elite table tennis players. International Journal of Performance Analysis in Sport 24, 495-509. Crossref |
Lanzoni, I.M., Di Michele, R., Merni, F. (2014) A notational analysis of shot characteristics in top-level table tennis players. European Journal of Sport Science 14, 309-317. Crossref |
McCullagh, P. and Nelder, J.A. (1989) Generalized Linear Models. 2nd
edition. Chapman and Hall. Crossref |
Molodzoff, P. (2008) Advanced coaching manual: A critique. International Table Tennis Federation. |
Murphy, A.P., Duffield, R., Kellett, A., Reid, M. (2016) A comparison of the perceptual and technical demands of tennis training, simulated match play, and competitive tournaments. International Journal of Sports Physiology and Performance 11, 40-47. Crossref |
Nikolovski, Z., Foretić, N., Vrdoljak, D., Marić, D., Perić, M. (2023) Comparison between match and training session on biomarker responses in handball players. Sports 11, 83. Crossref |
Owen, A.L., Lago-Peñas, C., Gómez, M.Á., Mendes, B., Dellal, A. (2017) Analysis of a training mesocycle and positional quantification in elite European soccer players. International Journal of Sports Science & Coaching 12, 665-676. Crossref |
Pfeiffer, M., Zhang, H., Hohmann, A. (2010) A Markov chain model of elite table tennis competition. International Journal of Sports Science & Coaching 5, 205-222. Crossref |
Rothe, F., Liu, R., Lames, M. (2025) Estimating the relevance of first offensive shot tactics in table tennis via simulation based on a finite Markov chain model. International Journal of Computer Science in Sport 24, Crossref |
Smith, D.J. (2003) A framework for understanding the training process leading to elite performance. Sports Medicine 33, 1103-1126. Crossref |
Tamaki, S., Yoshida, K., Yamada, K. (2017) A shot number based approach to performance analysis in table tennis. Journal of Human Kinetics 55, 7-18. Crossref |
Tang, J.J. (2009) Table tennis tactical system: The tactical formation of technical actions and their application models. Journal of Beijing Sport University 32, 105-107. |
Wenninger, S., Lames, M. (2016) Performance analysis in table tennis - stochastic simulation by numerical derivation. International Journal of Computer Science in Sport 15, 49-63. Crossref |
Wu, F., Liu, G.-B., Hua, C. J., Wu, J.P. (2014) Research on modifying the methods of studying table tennis technique and tactics. China Sport Science and Technology 50, 71-74. |
Wu, H.T., Wu, H., Cai, X.L., Sun, Q.L., Wang, S.Y., Chen, M. (1988) Strength evaluation and technical analysis of Chinese players for the 1988 Olympic Games. China Sport Science and Technology 24. |
Xiao, D., Zhou, X., Liu, H., Qin, Z., Yu, Y. (2018) The construction and application of double three-phase method on table tennis technique and tactics. China Sport Science and Technology 54, 112-116. |
Xu, J., Wei, Z., Liu, Y., Liu, G. (2019) A reconsideration of the segment attribution of the "5th shot" in the three-phase evaluation method of table tennis. Journal of Nanjing Sports Institute 2, 59-65. |
Xu, J.W., Sun, J.-Q., Tang, J.J. (2014) Research hotspots and prospects of table tennis technique and tactics analysis theory and methods in China. Journal of Nanjing Sport Institute (Natural Science Edition) 13, 4-11. |
Yang, Q., Zhang, H. (2014) Construction and application of four phase evaluation theory technique and tactics for table tennis. Journal of Tianjin University of Sport 29, 439-442. |
Yang, Q., Zhang, H. (2016) Characteristics of tactical factor relationships in elite table tennis players. Journal of Nanjing Sport Institute 30, 124-128. |
Zeger, S.L., Liang, K.-Y., Albert, P.S. (1988) Models for longitudinal data: A generalized estimating equation approach. Biometrics 44, 1049-1060. Crossref |
Zeger, S.L., Liang, K.Y. (1986) Longitudinal data analysis for discrete and continuous outcomes. Biometrics 42, 121-130. Crossref |
Zhang, H., Dai, J., Shi, F., Liu, Y., Wang, J. (2007) Research on technical & tactical characteristics of racket games. Journal of Shanghai University of Sport 31, 65-69. |
Zhang, H., Hohmann, A. (2004) Mathematical simulation and performance diagnosis of table tennis matches. Journal of Shanghai University of Sport 28, 68-72. |
Zhang, H., Hohmann, A. (2005) Theory and practice of performance diagnosis through mathematical simulation in ball games: A case study of table tennis match analysis. China Sport Science 25, 39-44. |
Zhang, H., Liu, W., Hu, J. (2015) Study on technique effectiveness of antagonistic sports events. China Sport Science 35, 44-49. |
Zhang, H., Liu, W., Hu, J., Liu, R. (2013) Evaluation of elite table tennis players’ technique effectiveness. Journal of Sports Sciences 31, 1526-1534. Crossref |
Zhang, H., Yang, Q. (2016) The expanded application of the "three-phase evaluation method" in technique and tactic analysis of table tennis matches. Sports Science Research 37, 61-66. |
Zhang, H., Zhou, Z. (2017) An analytical model of the two basic situation strategies in table tennis. International Journal of Performance Analysis in Sport 17, 970-985. Crossref |
Zhang, X. (2004) A Quantitative Diagnosis Method and Practical Utility
of Tactical Training Level in Chinese National Table Tennis
Team. Doctoral dissertation, Beijing Sport University. |
Zhang, X., Xiao, D., Zhou, X., Fang, W. (2018) The construction and application of dynamic three-phase method on table tennis technique and tactics. China Sport Science and Technology 54, 80-83. |
Zhou, Z., Zhang, H. (2022) A visible analysis approach for table tennis tactical benefit. Journal of Sports Science and Medicine 21, 517-527. Crossref |
Zhou, Z., Zhang, H. (2023) Is he or she the main player in table tennis mixed doubles? BMC Sports Science, Medicine and Rehabilitation 15, 3. Crossref |
|
| |
|
|
|
|