|
|
|
| |
| ABSTRACT |
|
Foot-strike patterns, including rearfoot strike (RFS), midfoot strike (MFS), and forefoot strike (FFS), are related to running injuries. Additionally, cumulative load is an important parameter when considering running injuries, but the cumulative loads of Achilles tendon force (ATF), plantar fascia force (PFF), and patellofemoral joint stress (PFJS) across all foot-strike patterns, including MFS, remain unknown. This study examined the effects of different foot-strike patterns during running, including MFS, on the peak values and cumulative load of ATF, PFF, and PFJS. Twenty healthy participants were enrolled in this study. The ATF, PFF, and PFJS during barefoot running with RFS, MFS, and FFS at 10 km/h were analyzed using a three-dimensional motion capture system and force plates. Their peak values and impulse per mile (an indicator of cumulative load) were calculated. These variables were statistically compared across foot strike patterns. The significance level was adjusted using the Bonferroni method for post-hoc tests (α = 0.016). Additionally, Cohen's d was used to calculate the effect size. The peak values and cumulative loads of the ATF and PFF were highest in FFS, followed by MFS and RFS. Conversely, the peak values and cumulative loads of the PFJS were higher in RFS and MFS than in FFS. Additionally, the effect size of impulse per mile was larger than that for peak values. The load is applied to different regions depending on the foot-strike pattern. ATF and PFF showed intermediate values at midfoot strike, MFS is suggesting that it may reduce the risk of developing or exacerbating Achilles tendinopathy and plantar fasciitis. Moreover, cumulative load may be a more meaningful parameter than peak values for estimating load during actual running. |
| Key words:
Running injury, midfoot strike, impulse, cumulative load
|
Key
Points
- The cumulative load of Achilles tendon force was high in forefoot strike.
- The cumulative load of planter fascia force was high in forefoot strike.
- The cumulative load of patellofemoral joint stress was high in rearfoot strike.
- Achilles tendon force and plantar fascia force showed intermediate values at midfoot strike.
- Midfoot strike may be useful for the prevention of Achilles tendinopathy and plantar fasciitis.
|
Running-related injuries include Achilles tendinopathy and plantar fasciitis in the foot, as well as patellofemoral pain in the knee. Achilles tendinopathy accounts for 18% of running-related injuries (McCrory et al., 1999). Plantar fasciitis was reported in 159 of 267 patients with running-related injuries in a previous study (Taunton et al., 2002). Patellofemoral pain is the most common running-related injury (Kakouris et al., 2021). These injuries are triggered and exacerbated by the load applied to the affected regions, such as the Achilles tendon, plantar fascia, and patellofemoral joint. Reducing the load on the Achilles tendon, plantar fascia, and patellofemoral joint may be important for preventing these injuries. A recent systematic review showed that foot-strike patterns may affect the risk of running-related injuries (Xu et al., 2021). Three types of foot-strike patterns exist: rearfoot strike (RFS), midfoot strike (MFS), and forefoot strike (FFS). Kulmala et al.’s study (Kulmala et al., 2013) reported that RFS increases the force on the patellofemoral joint compared with FFS, potentially increasing the risk of patellofemoral pain. Conversely, FFS increases the load on the soleus muscle and Achilles tendon, thereby increasing the risk of tendon disorders (Almonroeder et al., 2013). Furthermore, a previous study (Chen et al., 2019) reported a potential increase in plantar fascia force (PFF) compared to RFS. Therefore, the parts of the lower limb that are more likely to get injury depend on the foot-strike pattern. Interventions such as changing the foot-strike pattern to reduce load may be effective in one area but may have a detrimental effect on another region. A lack of previous studies describing the biomechanics of MFS remains evident. The proportions of foot-strike patterns changes depending on running speed and distance. Hanley et al. (Hanley et al., 2019) investigated half marathons and reported that the proportions of foot-strike patterns were RFS 62%, MFS 36%, and FFS 2%, with MFS being the second most common pattern after RFS. Previous studies (Almonroeder et al., 2013; Burke et al., 2021) compared the Achilles tendon force (ATF), PFF, and patellofemoral joint stress (PFJS) between runners with the RFS and non-RFS (NRFS) patterns. However, NRFS includes both FFS and MFS, and loads on the foot and knee joints are likely to change between FFS and MFS because they differ in the foot-ankle angle at ground contact. Therefore, classifying foot-strike patterns into three categories and examining the load on the foot and knee joints provides more detailed conditioning according to each runner's foot-strike pattern, which may help prevent running-related injuries. Many previous studies have focused on comparing peak value outcomes between foot-strike patterns, but the relationships between foot-strike patterns, including MFS, and repeated loading have not been established. The occurrence of Achilles tendinopathy, plantar fasciitis, and patellofemoral pain is multifactorial. Among the contributing factors, excessive repetitive loading on the Achilles tendon, plantar fascia, and patellofemoral joint is considered significant (Wearing et al., 2006; Willwacher et al., 2022). A recent study showed that the peak values do not reflect repetitive loading (Doyle et al., 2023). A review article (Anderson et al., 2020) compared peak loads (e.g., force, impulse, and stress) on the foot and knee joints owing to different foot-strike patterns, but it did not consider repetitive loading. Doyle et al. (Doyle et al., 2023) examined the effect of cumulative load at various running speeds and found that peak PFJS per step increased with running speed. However, the cumulative PFJS decreased after 1 km of continuous running. Based on these results, it is suggested that the present study should investigate not only the peak values but also the cumulative loads. Considering that injuries are associated with repetitive loading, it is necessary to use cumulative load indicators, such as impulse per mile, in addition to peak values for comparison. Moreover, previous studies evaluated each parameter individually, and the effects of foot-strike patterns on ATF, PFF, and PFJS have not been examined simultaneously. Previous studies (Almonroeder et al., 2013; Vannatta and Kernozek, 2015) differed in their experimental environments and participant characteristics, such as age and sex. Differences exist between the joint motions of elite and recreational runners (Evans et al., 2023; Quan et al., 2021) and between the magnitudes of muscle activity in treadmill and overground running (Oliveira et al., 2016). Therefore, it was not possible to make general comparisons with previous studies using different experimental conditions. Examining RFS, MFS, and FFS simultaneously in a single experiment can standardize factors such as experimental conditions and participants, enabling comparisons among the foot-strike patterns and providing a clearer understanding of the risks and benefits associated with each pattern. This study aimed to investigate the effects of differences in foot-strike patterns during running on the ATF, PFF, and PFJS. We hypothesized that the ATF and PFF would be the highest in FFS, followed by MFS and RFS, whereas the PFJS would be the highest in RFS, followed by MFS and FFS. ParticipantsThe participants were 20 healthy adult males (age: 21.7 ± 1.1 years, height: 171.2 ± 4.5 cm, body mass: 66.6 ± 9.3 kg). This study targeted male participants because lower extremity kinetics and ground reaction forces differ between males and females during running (Almonroeder and Benson, 2017; Jiang et al., 2024), which may influence the present results. An a priori sample size calculation, performed using G*Power 3.1 (University of Kiel, Germany), determined that a minimum of 19 participants were required, assuming an effect size of 0.7 (medium), a power of 0.8, and a critical alpha of 0.05. The sample size was calculated based on similar previous biomechanical studies (Doyle et al., 2023). We recruited participants from the university through word-of-mouth. The inclusion criteria were as follows: i) no history of Achilles tendinopathy, plantar fasciitis, or patellofemoral pain, and no history of other lower limb injuries within the past 6 months; ii) no history of lower limb surgery; and iii) no abnormal alignment, such as foot deformity. Foot alignment was evaluated using the arch height index (AHI) in the double-leg standing condition with an AHI measurement system (JAKTOOL LLC, Cranbury, NJ, USA). Participants with AHI > 0.310 were considered to have a normal foot based on the mean (standard deviation) AHI data in young Japanese students from a previous study (Takabayashi et al., 2020). This study was approved by the ethics committee (No.18638-210630). All participants provided written informed consent before enrollment in the experiment. After participants agreed to the contents and protocol of this study, the experiment began.
Experimental protocolA three-dimensional motion capture system (VICON, Oxford Metrics, UK) with 12 infrared cameras (250 Hz sampling rate), force plates (AMTI, USA; 1000 Hz sampling rate), and photocells (Dashr, Japan) was used. Based on the plug-in gait lower-body model, 16 infrared reflective markers with a diameter of 9.5 mm were placed on the lower limbs. The plug-in gait lower-body model was also used in running motion analyses in previous studies (Kulmala et al., 2013; Ogaya et al., 2021). The tasks involved running under three conditions: RFS, MFS, and FFS. Based on previous studies (Rice et al., 2023; Takabayashi et al., 2018), this study was conducted under barefoot conditions to observe the pure function of the foot without the influence of shoes. Additionally, the barefoot condition in this study helped eliminate potential marker displacement caused by shoe-foot movement. The participants ran along a 15 m laboratory runway with six force plates (width, 46 cm; length, 50 cm per force plate) embedded in the center. Based on a previous study (Besson et al., 2023), the running speed was standardized to 10 km/h ± 5% across the foot-strike patterns. Running speed was measured using a photocell. The proportion of foot-strike patterns changes depending on the running speed; however, the speed used in this study corresponds to the speed at which RFS, MFS, and FFS occur together in a marathon (Bovalino and Kingsley, 2021). Measurements were conducted after at least 10 min of practice to ensure that participants were accustomed to the task movements. Successful trials were defined as those in which i) the running speed was 10 km/h ± 5%, ii) the definitions of each foot-strike pattern were met, and iii) the right leg stepped on the force plate. Foot-strike patterns were determined based on the foot-strike angle (FSA) (Altman and Davis, 2012). The definitions of each foot-strike pattern were as follows: RFS = FSA > 8°, MFS = -1.6° < FSA > 8°, and FFS = FSA < -1.6°. Each participant underwent five measurement trials. The order of the foot-strike patterns was randomized for each participant. A 3-min rest period was allowed between each condition, and it was confirmed that participants did not experience fatigue.
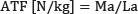
Data analysisThe marker and ground reaction force data were filtered using a second-order, zero-lag Butterworth low-pass filter with cut-off frequencies of 12 and 50 Hz, respectively. Angles of ankle plantarflexion/dorsiflexion, knee flexion/extension, and ankle and knee joint moments during running were analyzed using Nexus software (Vicon, Oxford, UK). Based on the vertical ground reaction force, the stance phase during running was determined. A threshold of 20 N in vertical ground reaction force was used to define initial contact and toe-off. The stance phase was normalized to 101 points. The ATF was calculated based on a previous report (Rugg et al., 1990), using a regression equation of the Achilles tendon moment arm (La) with the ankle plantarflexion/dorsiflexion angle (θa) as the independent variable (Eq.1). The ankle joint moment (Ma) was then divided by La to obtain the ATF (Eq.2).
 |
|
(Eq.1) |
 |
|
(Eq.2) |
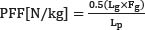
This calculation (Eq.2) is based on the net joint moment and does not consider only the plantarflexors. However, previous research (Kernozek et al., 2017) has reported that this method shows almost no difference in the ATF compared with high-precision calculation methods that consider antagonist muscles, such as the ankle dorsiflexors. Finally, ATF was normalized by kilograms (the unit of body mass) in this study. The PFF was calculated based on a previous study (Scott and Winter, 1990) (Eq.3).
 |
|
(Eq.3) |
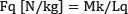
Fg is the ground reaction force, and Lp and Lg are the moment arms of the plantar fascia and ground reaction forces, respectively. Additionally, 0.5 indicates the degree of contribution of the plantar fascia. The lever arm, L(p), was determined from the marker position attached to the right lateral malleolus, the midpoint of the right second and third metatarsal heads, and the most posterior point of the right foot. Similar to the ATF, the PFF was normalized by kilograms (the unit of body mass). The PFJS was calculated in several steps based on previous research (Nunes et al., 2018). A lever arm of the quadriceps muscle (Lq) was determined at each knee flexion angle (θk) by fitting a nonlinear equation to the data (Whyte et al., 2010) (Eq.4). The quadriceps force (Fq) was calculated by dividing the knee extension moment (Mk) by the lever arm (Eq.5).
 |
|
(Eq.4) |
 |
|
(Eq.5) |
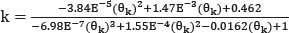
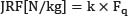
This knee extension moment is a net joint moment and does not account for the effect of knee flexors, but a systematic review concluded that it is currently the most appropriate method available (Nunes et al., 2018). The patellofemoral joint reaction force (JRF) was calculated by applying a nonlinear equation to data from a previous study (van Eijden et al., 1986), allowing for the calculation of a coefficient (k) specific to each knee flexion angle (Eq.6). The JRF was then determined by multiplying the quadriceps force by this coefficient for each respective flexion angle (Eq.7).
 |
|
(Eq.6) |
 |
|
(Eq.7) |
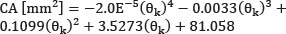
The patellofemoral joint contact area (CA) was calculated by fitting a fourth-order polynomial curve algorithm to the seven contact areas (Eq. 8) (Powers et al., 1998).
 |
|
(Eq.8) |
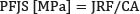
The CA is the patellofemoral contact area. Finally, the PFJS was calculated by dividing the patellofemoral JRF by the patellofemoral joint contact area (Eq.9).
 |
|
(Eq.9) |
The data from each participant, obtained from five successful trials, were averaged for each condition, and then the data for 20 participants were averaged. A total of 300 trials (20 participants, five successful trials for each participant, and three foot-strike patterns) were included in the data analysis. Among these, three trials did not meet the criteria for a successful trial (i.e., not stepping on the force plate and missing markers) and were therefore excluded from the analysis. Data analysis was performed using Scilab software version 6.1.0 (Enterprises, Versailles, France). The analysis items included stance times during running, steps per mile, ankle plantar flexion moment, knee extension moment, knee flexion angle, quadriceps force, peak values, time to peak, impulse per step, impulse per mile as an indicator of cumulative load for the ATF and PFF, PFJS, and contact area. The impulse per mile was calculated by multiplying the impulse per step by the number of steps in the right leg per mile. Therefore, repetitive high peak loads per mile are also accounted for in impulse per mile. The number of steps in the right leg was calculated by dividing 1,600 m (1 mile) by stride length (twice the step length), in reference to Willy et al’s study (Willy et al., 2016).
Statistical analysisFor data that followed a normal distribution, a paired t-test was applied. If the data did not follow a normal distribution, the Wilcoxon signed-rank test was used to compare the analytical items among the three foot-strike patterns. The significance level was adjusted using the Bonferroni method (α = 0.05/3 = 0.0167) because of multiple comparisons. Cohen's d was used to calculate the effect sizes among the foot-strike patterns. The effect sizes were interpreted as small (|0.2|-|0.5|), medium (|0.5|-|0.8|), and large (|>0.8|) (Cohen, 2013). All statistical analyses were performed using RStudio (version 4.4.0; The R Foundation for Statistical Computing, Vienna, Austria).
Results are summarized in Table 1. Figure 1 shows the foot-strike angles of individual participants (A) and the average across participants (B). The foot-strike patterns were clearly distinguishable, although the rearfoot strike pattern had slightly greater variability in foot-strike angles than the other patterns. Significant differences in foot-strike angles were observed among all foot-strike patterns (p < 0.016), and the effect sizes were all large. No significant differences instance time and steps per mile were found among the foot-strike patterns, and running speed was consistent; therefore, these factors are unlikely to have contributed to any differences observed in ATF, PFF, and PFJS peaks or impulses. The ankle plantar flexion moment was significantly higher in FFS, followed by MFS, and lowest in RFS. The peak values of the knee extension moment and knee flexion angle were significantly higher in RFS and MFS compared with FFS. Figure 2 shows the average waveform patterns of the ATF, PFF, and PFJS across all participants. Regarding the ATF and PFF, the peak values, impulse per step, and impulse per mile were significantly higher in FFS, followed by MFS, and lowest in RFS. In addition to the peak values, ATF and PFF throughout the stance phase were highest in FFS, followed by MFS, and lowest in RFS. For all parameters, MFS showed intermediate values between those of FFS and RFS. In the patellofemoral joint, quadriceps force, peak stress, peak reaction force, impulse per step, and impulse per mile of stress were significantly higher in RFS and MFS than in FFS. The contact area showed no significant differences among the foot-strike patterns. For the effect sizes of the ATF, PFF, and PFJS, the impulse per mile showed a larger effect size than the peak values (Table 1). In many cases, the effect sizes increased from small (peak values) to medium (impulse per mile) and from medium (peak values) to large (impulse per mile). This study found that the peak values, impulse per step, and impulse per mile of the ATF and PFF were significantly higher in FFS, followed by MFS, and lowest in RFS. Additionally, for the PFJS, the peak values, impulse per step, and impulse per mile were significantly higher in RFS and MFS than in FFS, supporting our hypothesis. This study is the first to explore the effects of differences in RFS, MFS, and FFS during running on the cumulative load of ATF, PFF, and PFJS. The strengths of this study are: 1) all outcomes were compared among foot-strike patterns, including MFS; 2) cumulative loads were quantified; and 3) the ATF, PFF, and PFJS were examined simultaneously. The ATF peak values were the highest for FFS, followed by MFS and RFS. According to calculations from previous research (Sinclair, 2014), the higher the plantar flexion moment, which is the numerator, the higher the ATF value. The results of this study showed that the plantar flexion moment was highest for FFS, followed by MFS and RFS. Therefore, the increase in plantar flexion moment is considered to contribute significantly to the increase in the ATF. In FFS, the center of pressure during early stance is located under the forefoot (Cavanagh and Lafortune, 1980), resulting in a longer moment arm from the center of pressure to the ankle joint center compared to other foot-strike patterns. This longer moment arm produces a greater external dorsiflexion moment. To counteract this, eccentric contraction of the triceps surae from initial contact to mid-stance helps convert more of the impact at contact into rotational energy (Lieberman et al., 2010). The increase in plantar flexion moment observed in this study may also be attributed to increased activity of the gastrocnemius and soleus muscles during FFS (Almonroeder et al., 2013). The PFF in MFS showed intermediate values between those at FFS and RFS. According to a previous study (Scott and Winter, 1990), PFF is calculated by dividing the ground reaction force moment by the lever arm; therefore, it is thought that the higher the ground reaction force, the higher the PFF. Previous studies (Taunton et al., 2002) reported that during the mid-stance phase, ground reaction forces are higher in FFS than in RFS, and that the ground reaction force in MFS is intermediate between those in FFS and RFS. Therefore, as the ground reaction force changes depending on the foot-strike pattern, the PFF may increase in the following order: FFS, MFS, and RFS. The impulse per mile was highest in FFS, followed by MFS and RFS, because no significant differences in stance time existed between the foot-strike patterns, and the ATF and PFF were highest in FFS throughout the stance phase. Furthermore, because no significant difference in steps per mile was observed between the foot-strike patterns, the ATF and PFF had the highest impulse per mile in FFS. The peak PFJS value, impulse per step, and impulse per mile were significantly higher in RFS and MFS than in FFS. This may be because quadriceps muscle activity increased with RFS and MFS. Lenhart (Lenhart et al., 2014) reported that quadriceps activity increases with greater knee flexion angles during running. The results of the present study showed that the knee flexion angle is higher in RFS and MFS than in FFS. Therefore, increased knee flexion angles are considered to lead to increased quadriceps activity, resulting in a higher PFJS in RFS and MFS from initial contact to mid-stance. The increase in knee joint flexion angle in RFS and MFS is thought to result from the shock absorption function of the joints. A previous study (Lieberman et al., 2010) reported that in FFS, the gastrocnemius-soleus muscles absorb impulses through eccentric contraction from initial contact to mid-stance. Conversely, in RFS and MFS, runners land with dorsiflexed ankles similar to those of a rigid body, resulting in minimal contribution from the ankle joint to impact absorption (Kulmala et al., 2013). For RFS and MFS, shock absorption is required at the knee joints. The increase in knee flexion angle led to higher quadriceps activity, resulting in a higher PFJS from initial contact to mid-stance. Therefore, both the peak values and impulse per step were high in RFS and MFS. As no significant difference in steps per mile was observed, impulse per mile was also higher in RFS and MFS than in FFS. This study showed that among all foot-related parameters, ATF and PFF were highest in FFS and the lowest in RFS. Therefore, RFS is considered desirable for reducing the load on the Achilles tendon and plantar fascia. Conversely, the PFJS was lowest in FFS, suggesting that FFS is desirable for reducing the load on the patellofemoral joint. Therefore, it may be necessary to change the foot-strike pattern depending on the region of the body where the load is to be reduced. However, a sudden change in the foot-strike pattern between FFS and RFS increases the risk of running-related injuries (Anderson et al., 2020). In the present study, MFS showed intermediate values between FFS and RFS for all analyzed parameters in the ATF and PFF. For some outcomes between MFS and FFS, the effect sizes were medium rather than small (impulse per step: -0.55; impulse per mile: -0.78; Table 1). Therefore, the inclusion of MFS when changing the foot-strike pattern allows for a more gradual transition, which may help prevent Achilles tendinopathy and plantar fasciitis. Additionally, the present study found that the effect size of impulse per mile was greater than that of the peak value across foot-strike patterns (Table 1). Considering the potential influence of cumulative load, future studies should incorporate both peak values and cumulative load when analyzing running biomechanics. The present study had some limitations. First, it did not include habitual runners or female participants. Because the same male participants performed all three foot-strike patterns, they received sufficient practice before the measurement. However, it is possible that participants ran using unfamiliar foot-strike patterns. Second, this study was conducted with participants running barefoot. The parameters necessary for analyzing ATF and PF were calculated from the marker positions on the foot, which were attached directly to the skin to ensure accurate analysis. Lastly, foot-strike patterns were categorized, and outcomes were compared among the three conditions. Although the foot-strike patterns were distinguishable for all participants, some had similar foot-strike angles between conditions (e.g., midfoot strike and forefoot strike for participant 1, and rearfoot strike and midfoot strike for participant 10; Figure 1A). These similarities in foot-strike angles may have contributed to nonsignificant differences in some outcomes. These limitations need to be addressed in future studies. These results suggest that the load is applied to different regions depending on the foot-strike pattern. MFS may be useful for gradual transitions from RFS to FFS and may help reduce the risk of developing or exacerbating Achilles tendinopathy or plantar fasciitis.
| ACKNOWLEDGEMENTS |
No funding is associated with the work featured in this article. The experiments comply with the current laws of the country in which they were performed. The authors have no conflict of interest to declare. The datasets generated during and/or analyzed during the current study are not publicly available but are available from the corresponding author, who was an organizer of the study. |
|
| AUTHOR BIOGRAPHY |
|
 |
Honoka Nishiguchi |
| Employment: Graduate School, Niigata University of Health and Welfare, Niigata, Japan |
| Degree: Bachelor |
| Research interests: Sports Biomechanics |
| E-mail: hpm24010@nuhw.ac.jp |
| |
|
Tomoya Takabayashi |
| Employment: Institute for Human Movement and Medical Sciences, Niigata University of Health and Welfare Niigata City, Japan |
| Degree: PhD |
| Research interests: Sports biomechanics |
| E-mail: takabayashi@nuhw.ac.jp |
| |
|
Takanori Kikumoto |
| Employment: Institute for Human Movement and Medical Sciences, Niigata University of Health and Welfare, Niigata, Japan |
| Degree: MSc |
| Research interests: Sports biomechanics |
| E-mail: kikumoto@nuhw.ac.jp |
| |
|
Masayoshi Kubo |
| Employment: Institute for Human Movement and Medical Sciences, Niigata University of Health and Welfare, Niigata, Japan |
| Degree: ScD |
| Research interests: Sports biomechanics |
| E-mail: kubo@nuhw.ac.jp |
| |
|
| |
| REFERENCES |
 Almonroeder T. G., Benson L. C. (2017) Sex differences in lower extremity kinematics and patellofemoral kinetics during running. Journal of Sports Sciences 35, 1575-1581. |
Almonroeder T., Willson J. D., Kernozek T. W. (2013) The effect of foot strike pattern on achilles tendon load during running. Annals of Biomedical Engineering 41, 1758-1766. Crossref |
Altman A. R., Davis I. S. (2012) A kinematic method for footstrike pattern detection in barefoot and shod runners. Gait & Posture 35, 298-300. Crossref |
Anderson L. M., Bonanno D. R., Hart H. F., Barton C. J. (2020) What are the benefits and risks associated with changing foot strike pattern during running? A systematic review and meta-analysis of injury, running economy, and biomechanics. Sports Medicine 50, 885-917. Crossref |
Besson T., Sabater Pastor F., Varesco G., Berthet M., Kennouche D., Dandrieux P. E., Rossi J., Millet G. Y. (2023) Elite vs. experienced male and female trail runners: Comparing running economy, biomechanics, strength, and power. Journal of Strength and Conditioning Research 37, 1470-1478. Crossref |
Bonacci J., Vicenzino B., Spratford W., Collins P. (2014) Take your shoes off to reduce patellofemoral joint stress during running. British Journal of Sports Medicine 48, 425-428. Crossref |
Bovalino S. P., Kingsley M. I. C. (2021) Foot strike patterns during overground distance running: A systematic review and meta-analysis. Sports Medicine - Open 7, 82-. Crossref |
Burke A., Dillon S., O'Connor S., Whyte E. F., Gore S., Moran K. A. (2021) Risk factors for injuries in runners: A systematic review of foot strike technique and its classification at impact. Orthopaedic Journal of Sports Medicine 9, 23259671211020283. Crossref |
Cavanagh P. R., Lafortune M. A. (1980) Ground reaction forces in distance running. Journal of Biomechanics 13, 397-406. Crossref |
Chen T. L., Wong D. W., Wang Y., Lin J., Zhang M. (2019) Foot arch deformation and plantar fascia loading during running with rearfoot strike and forefoot strike: A dynamic finite element analysis. Journal of Biomechanics 83, 260-272. Crossref |
Cohen, J. (2013) Statistical power analysis for the behavioral sciences.
Routledge. Crossref |
Doyle E. W., Doyle T. L. A., Bonacci J., Beach A. J., Fuller J. T. (2023) Cumulative patellofemoral force and stress are lower during faster running compared to slower running in recreational runners. Sports Biomechanics , 1-13. Crossref |
Evans R. J., Moffit T. J., Mitchell P. K., Pamukoff D. N. (2023) Injury and performance related biomechanical differences between recreational and collegiate runners. Frontiers in Sports and Active Living 5, 1268292. Crossref |
Hanley B., Bissas A., Merlino S., Gruber A. H. (2019) Most marathon runners at the 2017 IAAF World Championships were rearfoot strikers, and most did not change footstrike pattern. Journal of Biomechanics 92, 54-60. Crossref |
Jiang X., Bíró I., Sárosi J., Fang Y., Gu Y. (2024) Comparison of ground reaction forces as running speed increases between male and female runners. Frontiers in Bioengineering and Biotechnology 12, 1378284. Crossref |
Kakouris N., Yener N., Fong D. T. P. (2021) A systematic review of running-related musculoskeletal injuries in runners. Journal of Sport and Health Science 10, 513-522. Crossref |
Kernozek T., Gheidi N., Ragan R. (2017) Comparison of estimates of Achilles tendon loading from inverse dynamics and inverse dynamics-based static optimisation during running. Journal of Sports Sciences 35, 2073-2079. Crossref |
Kulmala J.-P., Avela J., Pasanen K., Parkkari J. (2013) Forefoot strikers exhibit lower running-induced knee loading than rearfoot strikers. Medicine & Science in Sports & Exercise 45, 2306-2313. Crossref |
Lenhart R. L., Thelen D. G., Wille C. M., Chumanov E. S., Heiderscheit B. C. (2014) Increasing running step rate reduces patellofemoral joint forces. Medicine and Science in Sports and Exercise 46, 557-564. Crossref |
Lieberman D. E., Venkadesan M., Werbel W. A., Daoud A. I., D'Andrea S., Davis I. S., Mang'eni R. O., Pitsiladis Y. (2010) Foot strike patterns and collision forces in habitually barefoot versus shod runners. Nature 463, 531-535. Crossref |
McCrory J. L., Martin D. F., Lowery R. B., Cannon D. W., Curl W. W., Read H. M., Hunter D. M., Craven T., Messier S. P. (1999) Etiologic factors associated with Achilles tendinitis in runners. Medicine and Science in Sports and Exercise 31, 1374-1381. Crossref |
Nunes G. S., Scattone Silva R., Dos Santos A. F., Fernandes R. A. S., Serrão F. V., de Noronha M. (2018) Methods to assess patellofemoral joint stress: A systematic review. Gait & Posture 61, 188-196. Crossref |
Ogaya S., Suzuki M., Yoshioka C., Nakamura Y., Kita S., Watanabe K. (2021) The effects of trunk endurance training on running kinematics and its variability in novice female runners. Sports Biomechanics , 1-12. Crossref |
Oliveira A. S., Gizzi L., Ketabi S., Farina D., Kersting U. G. (2016) Modular control of treadmill vs overground running. PLoS ONE 11, e0153307. Crossref |
Powers C. M., Lilley J. C., Lee T. Q. (1998) The effects of axial and multi-plane loading of the extensor mechanism on the patellofemoral joint. Clinical Biomechanics 13, 616-624. Crossref |
Quan W., Zhou H., Xu D., Li S., Baker J. S., Gu Y. (2021) Competitive and recreational running kinematics examined using principal components analysis. Healthcare 9, 1300. Crossref |
Rice H., Seynnes O., Werkhausen A. (2023) Effect of increased running speed and weight carriage on peak and cumulative tibial loading. Scandinavian Journal of Medicine & Science in Sports 33, 2516-2523. Crossref |
Rugg S. G., Gregor R. J., Mandelbaum B. R., Chiu L. (1990) In vivo moment arm calculations at the ankle using magnetic resonance imaging (MRI). Journal of Biomechanics 23, 495-501. Crossref |
Scott S. H., Winter D. A. (1990) Internal forces of chronic running injury sites. Medicine and Science in Sports and Exercise 22, 357-369. Crossref |
Sinclair J. (2014) Effects of barefoot and barefoot inspired footwear on knee and ankle loading during running. Clinical Biomechanics 29, 395-399. Crossref |
Takabayashi T., Edama M., Inai T., Nakamura E., Kubo M. (2020) Effect of gender and load conditions on foot arch height index and flexibility in Japanese youths. The Journal of Foot and Ankle Surgery 59, 1144-1147. Crossref |
Takabayashi T., Edama M., Yokoyama E., Kanaya C., Kubo M. (2018) Quantifying coordination among the rearfoot, midfoot, and forefoot segments during running. Sports Biomechanics 17, 18-32. Crossref |
Taunton J. E., Ryan M. B., Clement D. B., McKenzie D. C., Lloyd-Smith D. R., Zumbo B. D. (2002) A retrospective case-control analysis of 2002 running injuries. British Journal of Sports Medicine 36, 95-101. Crossref |
van Eijden T. M., Kouwenhoven E., Verburg J., Weijs W. A. (1986) A mathematical model of the patellofemoral joint. Journal of Biomechanics 19, 219-229. Crossref |
Vannatta C. N., Kernozek T. W. (2015) Patellofemoral joint stress during running with alterations in foot strike pattern. Medicine and Science in Sports and Exercise 47, 1001-1008. Crossref |
Wearing S. C., Smeathers J. E., Urry S. R., Hennig E. M., Hills A. P. (2006) The pathomechanics of plantar fasciitis. Sports Medicine 36, 585-611. Crossref |
Wei Z., Hou X., Qi Y., Wang L. (2024) Influence of foot strike patterns and cadences on patellofemoral joint stress in male runners with patellofemoral pain. Physical Therapy in Sport 65, 1-6. Crossref |
Whyte E. F., Moran K., Shortt C. P., Marshall B. (2010) The influence of reduced hamstring length on patellofemoral joint stress during squatting in healthy male adults. Gait & Posture 31, 47-51. Crossref |
Willwacher S., Kurz M., Robbin J., Thelen M., Hamill J., Kelly L., Mai P. (2022) Running-related biomechanical risk factors for overuse injuries in distance runners: A systematic review considering injury specificity and the potentials for future research. Sports Medicine 52, 1863-1877. Crossref |
Willy R. W., Halsey L., Hayek A., Johnson H., Willson J. D. (2016) Patellofemoral joint and Achilles tendon loads during overground and treadmill running. Journal of Orthopaedic & Sports Physical Therapy 46, 664-672. Crossref |
Xu Y., Yuan P., Wang R., Wang D., Liu J., Zhou H. (2021) Effects of foot strike techniques on running biomechanics: A systematic review and meta-analysis. Sports Health 13, 71-77. Crossref |
|
| |
|
|
|
|