|
|
|
| |
| ABSTRACT |
|
The instep kick is a frequently performed, high-load soccer skill that requires precise intermuscular coordination around ball contact. This study compared time-frequency activation patterns between elite and amateur male soccer players across two kicking phases and identified the key time windows and dominant muscle contributions. Surface electromyography was recorded from seven muscles of the kicking leg in 15 elite and 15 amateur players: rectus femoris, vastus medialis, vastus lateralis, biceps femoris, tibialis anterior, medial gastrocnemius, and lateral gastrocnemius. The instep kick was divided into Phase 1, from maximum hip extension to ball contact, and Phase 2, from post-contact follow-through to maximum hip flexion. Morlet wavelet analysis was used to generate time-frequency intensity maps. Global principal component analysis was then performed to extract PC1 to PC6, and between-group differences in PC score trajectories were assessed using SPM1D independent-samples t tests, with significance evaluated under a Bonferroni adjusted threshold for the 12 PC phase comparisons. In Phase 1, PC3 showed a significant between-group difference at 54-75% of the normalized time (peak t = 7.62, p < 0.001, Hedges’ g = 2.96), with higher scores in the elite group. In Phase 2, PC1 differed significantly between groups at 60-70% of the normalized time (peak t = -9.88, p < 0.001, Hedges’ g = -2.03), with higher scores in the amateur group. Elite players showed a more temporally focused pre-contact activation pattern centered on mid-frequency components of the biceps femoris, whereas amateur players showed greater reliance on higher-frequency components of the medial gastrocnemius during the post-contact follow-through. These findings suggest that skill-level differences are expressed as phase-specific redistribution of muscle and frequency-band activity within critical time windows, rather than as a simple global difference in activation magnitude. |
| Key words:
Soccer, instep kick, electromyography, frequency, muscle activation
|
Key
Points
- Time frequency analysis combined with global PCA revealed phase specific neuromuscular differences between elite and amateur soccer players during the instep kick.
- Elite and amateur players exhibited phase specific differences in neuromuscular control, particularly in pre contact preparation and post contact follow through.
- Elite players showed a more temporally concentrated pre-contact activation pattern, characterized by greater biceps femoris mid-frequency contribution during the mid- to late pre-contact period.
- Amateur players showed greater medial-gastrocnemius-related high-frequency contribution during the post-contact phase, indicating a different plantar-flexor-related EMG time-frequency organization during follow-through.
|
The instep kick is a frequently performed, high-load soccer skill that requires rapid and coordinated activation of multiple lower-limb muscles (Zhang et al., 2025). During this standardized kicking task, the kicking limb undergoes a high-speed swing, brief ball contact, and rapid post-contact follow-through. These movement demands require coordinated regulation of swing acceleration, joint stability, ankle-foot positioning, and follow-through control before and after ball contact (Peacock and Ball, 2018; Kellis and Katis, 2007). Therefore, the instep kick provides an appropriate task for examining phase-specific neuromuscular activation patterns of the kicking leg. The present study examined the time-frequency characteristics of surface electromyography (sEMG) signals during a standardized instep kicking task, with particular attention to how lower-limb muscle activity is organized from maximum hip extension through ball contact and during the subsequent follow-through (Brophy et al., 2007). The instep kick can be functionally divided into two phases with distinct neuromuscular control demands. The pre-contact phase, from maximum hip extension to ball contact, reflects preparation and acceleration of the kicking limb, during which proximal-to-distal coordination is required to transfer segmental momentum toward the foot. During this sequence, the quadriceps muscles, including the rectus femoris, vastus medialis, and vastus lateralis, contribute to knee extension and forward acceleration of the kicking limb, whereas the biceps femoris may assist in hip extension, knee flexion control, and limb deceleration around ball contact. Distal muscles, including the tibialis anterior and the medial and lateral gastrocnemius, contribute to ankle-foot positioning, foot stiffness, and post-contact regulation. In contrast, the post-contact follow-through phase, from ball contact to maximum hip flexion, reflects the regulation of residual limb momentum and stabilization after impact. Therefore, separating the instep kick into these two phases enables the analysis to distinguish neuromuscular activation patterns associated with pre-contact preparation from those associated with post-contact regulation, rather than treating the entire kicking action as a single homogeneous movement. At the neuromuscular level, surface electromyography (sEMG) provides information that cannot be directly captured by joint kinematics, including when a muscle is activated, how long activation is sustained, the intensity of its contribution, and how different muscles interact through synergistic or antagonistic regulation across movement phases (Bansal et al., 2011). By characterizing the timing and magnitude of muscle activity, sEMG is essential for understanding neuromuscular control during motor execution (Beck et al., 2012). However, EMG amplitude should not be interpreted as a direct equivalent of mechanical output, because previous time-resolved EMG evidence from dynamic jumping tasks has shown that improved mechanical performance may occur without proportional increases in lower-limb EMG activity (Kovács et al., 2023). In addition, shooting is a typical nonstationary process in which EMG signals vary rapidly over time, and their spectral content may change dynamically in response to contraction mode, mechanical conditions, and movement-related activation demands. Conventional time-domain metrics, such as root mean square (RMS) and integrated EMG (iEMG), may conflate brief activation bursts with sustained activation, whereas global frequency-domain indices, such as mean frequency (MNF) and median frequency (MDF), are insufficient to fully capture the time- and frequency-dependent structure of muscle activation during fast skill-based movements (von Tscharner, 2000; Farina et al., 2004). For example, two kicks may show similar RMS values in a given muscle, while one signal contains a brief high-frequency activation burst before ball contact and another shows a more prolonged lower-frequency activation pattern during follow-through. Time-frequency analysis provides a methodological basis for addressing these limitations. In particular, the continuous wavelet transform (CWT) is well suited to nonstationary signals such as EMG and has become increasingly important in EMG research. It enables simultaneous characterization of instantaneous features in both the time and frequency domains, thereby offering greater physiological and functional interpretability (Di Nardo et al., 2022; Shi et al., 2025; Frère, 2017). In soccer and other dynamic sport tasks, EMG time-frequency analysis has attracted increasing attention because it can characterize transient changes in muscle activation that may not be captured by discrete amplitude or global frequency metrics alone. Previous studies have used time-frequency approaches, including the continuous wavelet transform and wavelet-based intensity measures, to examine lower-limb EMG characteristics during running, cutting, and sprinting. These studies have reported task- and phase-dependent differences in activation timing and spectral distribution across specific movement intervals (Shi et al., 2025; Di Nardo et al., 2022). However, these findings may not directly transfer to the instep kick because running and sprinting are cyclic locomotor tasks, and cutting is dominated by stance-phase braking and direction change, whereas the instep kick is a rapid, non-cyclic kicking action involving a high-speed swing, brief ball contact, and post-contact follow-through. The instep kick requires rapid intermuscular coordination of the lower limb, and muscle activation may show phase-dependent changes in both timing and spectral distribution around ball contact. In this context, wavelet-derived frequency-band characteristics should be interpreted as descriptive features of the recorded EMG signal rather than as direct evidence of performance mechanisms. Such features may help characterize how muscle activation is organized across time and frequency during a standardized kicking task, but they do not directly indicate goal success, shooting accuracy, movement economy, or superior competitive performance. Therefore, the present study used time-frequency analysis to examine phase-specific EMG activation patterns and to determine whether these patterns differed between elite and amateur players. Conventional short-time Fourier transform methods are constrained by a fixed window length and may therefore be limited in their ability to resolve rapid changes in EMG signals during short movement phases. In contrast, the wavelet transform provides a multiresolution representation, with better frequency resolution at lower frequencies and better time resolution at higher frequencies, making it suitable for examining nonstationary EMG signals during fast sport movements (Torrence and Compo, 1998; Mallat, 1989). This methodological advantage allows wavelet-based analysis to describe short-duration changes in EMG time-frequency structure during the instep kick, including changes in energy distribution across frequency bands and time windows. It therefore provides descriptive information about phase-specific differences in lower-limb muscle activation patterns between elite and amateur players. Applying time-frequency analysis to soccer shooting is well matched to the task demands because key neuromuscular adjustments may occur within brief, phase-dependent time windows around ball contact. The late pre-contact period may involve ankle-foot positioning and coordinated regulation of the kicking limb, whereas the post-contact follow-through period may involve regulation of residual limb motion and continued intermuscular coordination (Kellis and Katis, 2007; Brophy et al., 2007; Rabello et al., 2022). These transient dynamics are difficult to characterize using discrete EMG metrics alone. Accordingly, phase-specific time-frequency analysis provides a suitable approach for examining whether systematic differences in the temporal and frequency-band organization of lower-limb muscle activity exist between elite and amateur players, determining in which phase they emerge, and identifying the muscles and frequency bands that contribute most strongly to the observed EMG patterns. In summary, this study aimed to examine phase-specific time-frequency activation patterns of lower-limb muscles during a standardized instep kick in elite and amateur soccer players. Surface electromyography signals from seven muscles of the kicking leg were analyzed using Morlet wavelet transformation, global principal component analysis, and SPM1D. PCA was used to reduce the high-dimensional muscle × frequency × time structure of EMG activity into a smaller set of common multimuscle time-frequency activation patterns. The resulting PCA-derived score trajectories allowed between-group differences to be tested across normalized movement time using SPM1D. In interpreting the wavelet-derived features, lower-frequency components were considered to reflect slower or more sustained changes in EMG intensity, mid-frequency components were considered to represent the main EMG power distribution during task-related activation, and higher-frequency components were considered to reflect brief and rapidly changing EMG activity. These frequency components were interpreted as descriptive spectral features of the recorded EMG signal rather than as direct indicators of motor unit recruitment or performance mechanisms. Based on the functional roles of the measured muscles, the biceps femoris was expected to contribute to pre-contact hip-knee control and limb deceleration around ball contact, whereas the medial gastrocnemius was expected to contribute to ankle-foot regulation and post-contact follow-through control. We hypothesized that elite and amateur players would exhibit different PCA-derived PC score trajectories during the pre-contact phase, from maximum hip extension to ball contact, and during the post-contact follow-through phase, from ball contact to maximum hip flexion. The muscle and frequency-band contributions to any significant PC score differences were subsequently interpreted based on the PCA loadings and SPM1D results. ParticipantsThe required sample size was estimated a priori using G*Power 3.1 (Franz Faul, Germany) (Faul et al., 2009). Because no established effect size is available for wavelet-based PCA and SPM1D analyses of EMG time-frequency patterns during soccer instep kicking, the calculation was based on an independent-samples comparison between two groups and assumed a large standardized effect size (Cohen’s d = 1.06). The test family was set to t tests, and the statistical test was set to means: difference between two independent means (two-tailed), with α = 0.05, statistical power (1 - β) = 0.80, and an allocation ratio of 1:1. This analysis indicated that a minimum total sample size of 30 participants was required, with 15 participants in each group. Based on the inclusion criteria proposed by Matsunaga and Kaneoka (2018), a total of 30 male soccer players were recruited, including 15 amateur and 15 elite players. Because the main inferential analysis involved six principal components across two kicking phases, the G*Power calculation was treated as an approximation for detecting large between-group effects, and the final SPM1D inference was evaluated using a Bonferroni-adjusted threshold across the 12 PC-phase comparisons. Elite players were defined as those holding a national first-class athlete certification in soccer or higher, with more than five years of structured training, a weekly training volume of at least 10 hours, and experience competing in high-level soccer leagues. Participant characteristics and training backgrounds are presented in Table 1. The elite and amateur groups did not differ significantly in age, height, or body mass. As expected from the group classification criteria, the elite group had greater training experience and weekly training volume than the amateur group. All participants used their dominant leg for the instep kicking task, and dominant-leg distribution was comparable between groups. Playing position distribution was also examined descriptively and showed no obvious imbalance between groups. All participants were in good health, had no history of surgery within the previous six months, and had no musculoskeletal injuries or related diseases. To minimize the potential influence of pre-test fatigue, all participants avoided high-intensity training or competition within 24 hours before testing. This study complied with the Declaration of Helsinki, and written informed consent was obtained from all participants. Ethical approval was granted by the Ethics Committee of the Institute of Public Health, Ningbo University (TY2025077).
Experimental protocolA 10 camera motion capture system (Vicon, Oxford Metrics Ltd., Oxford, UK), was used to record the three-dimensional positions of 32 reflective markers placed on the pelvis and lower limbs at a sampling rate of 200 Hz. The marker set included three upper-body markers, three pelvis markers, and 13 lower-limb markers on each side. Detailed marker placement is presented in Table 2. The upper-body markers were placed on the bilateral acromion processes and sternum. The pelvis was defined using markers placed on the right and left anterior superior iliac spines and a posterior pelvis marker placed over the sacral region. For each lower limb, the thigh segment was tracked using three thigh markers and markers placed on the medial and lateral femoral epicondyles. The shank segment was tracked using three shank markers and markers placed on the medial and lateral malleoli. The foot segment was tracked using markers placed on the heel and the medial and lateral forefoot. Surface electromyography (sEMG) signals were synchronously collected at 2000 Hz using a Delsys system (Delsys Inc., Boston, MA, USA). Following the SENIAM recommendations (http://www.seniam.org/), the skin was shaved, lightly abraded, and cleaned with alcohol wipes before electrode placement. sEMG sensors were placed over the muscle bellies of seven muscles of the kicking leg: rectus femoris (RF), biceps femoris (BF), vastus medialis (VM), vastus lateralis (VL), tibialis anterior (TA), medial gastrocnemius (MG), and lateral gastrocnemius (LG) (Figure 1a) (Wang et al., 2026; Zhu et al., 2025). The bipolar sensors had a fixed inter-electrode distance of 10 mm, and the long axis of each sensor was aligned parallel to the underlying muscle fibre direction to reduce crosstalk from adjacent muscles. RF sensors were placed approximately midway between the anterior superior iliac spine and the superior border of the patella; BF sensors were placed midway between the ischial tuberosity and the lateral femoral epicondyle; VM sensors were placed on the distal medial thigh, proximal to the superomedial border of the patella; VL sensors were placed on the lateral thigh along the line from the anterior superior iliac spine to the lateral border of the patella; TA sensors were placed on the proximal third of the line between the fibular head and the medial malleolus; and MG and LG sensors were placed over the most prominent regions of the medial and lateral gastrocnemius muscle bellies, respectively. After electrode placement, brief voluntary contractions, including knee extension, knee flexion, ankle dorsiflexion, and plantarflexion, were performed for each muscle to visually confirm signal quality and muscle-specific activation. The sensors and cables were secured with elastic adhesive tape to minimize movement artefacts during the kicking task. Participants then completed a 10-min light jogging warm-up followed by a 5-min soccer-specific dynamic warm-up. After warming up, each participant performed two maximal-effort instep shots to become familiar with the required testing intensity. Testing was conducted on an indoor artificial turf surface. All participants used the same size 5 soccer ball, with ball pressure standardized to 10 psi and verified using a pressure gauge (Zhou et al., 2025). Participants struck the ball with their dominant kicking leg, using their habitual shooting angle (30° to 45°) and a self-selected approach distance of no more than 2 m (Cerrah et al., 2024). Participants were instructed to kick with maximal effort and to aim as accurately as possible at the center of the goal (Apriantono et al., 2006). All participants performed repeated instep kicking trials with a 30-s rest interval between attempts (Mei et al., 2014), and trials were repeated until each participant completed three valid kicks. A kick was considered valid if (1) ball speed was within ± 5% of the individual target speed and (2) the ball trajectory was directed toward the central area of the goal. The individual target speed was defined as the mean ball speed of three maximal-effort shots performed by each participant during the familiarization phase before formal testing. The number of attempts required to obtain three valid kicks was recorded for each participant and did not differ significantly between groups (elite: 3.47 ± 0.64 attempts; amateur: 3.67 ± 0.72 attempts; p = 0.429). The invalid trial rate was also similar between groups (elite: 7/52 trials, 13.5%; amateur: 10/55 trials, 18.2%; p = 0.601). Invalid trials were mainly caused by ball speed falling outside the ± 5% target range or by the ball trajectory not being directed toward the central target area. No participant reported fatigue or muscle discomfort requiring termination of testing or additional rest beyond the planned 30-s interval. Ball speed was obtained using video-based kinematic analysis. Each shot was recorded with a high-speed camera (Casio EX-ZR100) at 240 fps (240 Hz), with the camera positioned lateral to the ball location and perpendicular to the plane of ball motion. A calibration object of known length was placed in the kicking plane before testing to define the spatial scale in Kinovea (v0.8.15; Association Kinovea, France) (Zhou et al., 2023). The ball center was manually digitized frame by frame over the initial post-contact flight frames, and ball speed was calculated as the linear displacement of the ball center divided by the corresponding time interval. To assess measurement reliability, a random subset of 20 trials was digitized twice by the same analyst with an interval of 7 days. Reliability was assessed using ICC(3, 1), and measurement error was quantified using the standard error of measurement. Intrarater reliability was excellent (ICC = 0.96), and the measurement error was 0.21 m·s-1. All three valid kicks were retained for subsequent processing rather than selecting a single best-performing trial.
Data processingKinematic data were processed using the Visual3D biomechanical analysis system (v6; HAS-Motion, Kingston, ON, Canada) and low-pass filtered with a fourth-order zero-phase Butterworth filter at a cutoff frequency of 10 Hz (Sinclair et al., 2013). Based on the 32-marker full-body model described above, the pelvis, thigh, shank, and foot segments were reconstructed in Visual3D. Hip joint angles of the kicking limb were calculated as the orientation of the thigh segment relative to the pelvis segment. The sagittal-plane hip angle was then used to identify the maximum hip extension and maximum hip flexion events. The instep kick was characterized by three key events: maximum hip extension, ball contact, and maximum hip flexion. Maximum hip extension was defined as the minimum sagittal-plane hip flexion angle of the kicking limb before ball contact. Ball contact was identified from high-speed video inspection as the first frame in which the dorsum of the kicking foot contacted the ball, with marker trajectory information used as supporting confirmation. Maximum hip flexion was defined as the maximum sagittal-plane hip flexion angle of the kicking limb after ball contact. Based on these events, two main phases were defined (Figure 1b): the upward swing phase, from maximum hip extension of the kicking leg to ball contact, and the post-contact forward follow-through phase, from ball contact to maximum hip flexion of the kicking leg (Watanabe et al., 2020). To assess event-detection reliability, a random subset of 20 trials was re-identified twice by the same analyst with an interval of 7 days. Intrarater reliability was assessed using ICC(3, 1), and timing error was quantified as the mean absolute difference between repeated event detections. Event-detection reliability was excellent (ICC = 0.96), with a mean absolute timing difference of 1.2 frames, corresponding to 5.0 ms. Raw EMG signals from the seven muscles were first visually inspected to identify obvious artifacts. No notch filter was applied because no substantial power-line noise was observed in the raw EMG signals. The raw EMG signals were then band-pass filtered between 20 and 450 Hz using a fourth-order zero-phase Butterworth filter to reduce low-frequency movement artifacts and high-frequency noise while preserving the main spectral content of the surface EMG signal. The band-pass-filtered, non-rectified EMG signals were entered into the Morlet wavelet transform. Rectification was not performed before wavelet transformation because wavelet intensity was subsequently calculated as the squared magnitude of the complex wavelet coefficients, thereby quantifying the time-frequency power of the EMG signal. The 20-450 Hz band-pass range was selected as a conventional preprocessing range for surface EMG during dynamic movement. The lowest Morlet wavelet center frequency of 6.90 Hz was retained as part of the predefined 11-band wavelet filter bank used for time-frequency decomposition. Because the EMG signals had already been high-pass filtered at 20 Hz, the lowest wavelet band was interpreted cautiously as a residual low-frequency contribution after preprocessing rather than as unfiltered movement artifact. The main interpretation therefore focused on the distribution of wavelet intensity across the complete set of frequency bands. To obtain time-frequency features, Morlet wavelet transforms were computed using FFT-based convolution to derive time-frequency coefficients for each frequency band. The center frequencies of the Morlet wavelets were 6.90, 19.29, 37.71, 62.09, 92.36, 128.48, 170.39, 218.08, 271.50, 330.63, and 395.46 Hz (von Tscharner, 2000). Wavelet intensity was calculated as the squared magnitude of the coefficients (Figure 1c) (Triwiyanto et al., 2017; Ghosh and Swaminathan, 2020).
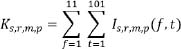
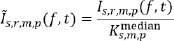
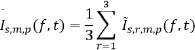
Equation (1) presents the Morlet continuous wavelet transform applied to the within-phase EMG signal x(t), yielding the complex time-frequency coefficients W(f,t), which characterize the instantaneous oscillatory components of the signal in the vicinity of time t and around the center frequency f. Equation (2) defines the time-frequency intensity I(f,t) as the squared magnitude of the complex coefficients, which was used to quantify the energy and intensity at each time-frequency point. In these equations, x(τ) denotes the EMG signal at time τ, where τ is the integration variable; f is the wavelet center frequency; t is the time-localization parameter that determines the time point associated with the time-frequency coefficient; ψf(⋅) is the Morlet wavelet basis function scaled to the center frequency f. Following commonly used settings in previous time-frequency analyses, 11 center frequencies were selected to construct the band-specific intensity matrix. The time-frequency intensity within each phase was then linearly interpolated and time-normalized to 101 time points, yielding an 11 × 101 time-frequency intensity matrix for each muscle (Cai et al., 2026). To reduce the influence of overall amplitude differences between trials, wavelet intensity was normalized after the Morlet wavelet transformation using a participant specific scaling procedure. For each participant (s), trial (r), muscle (m), and phase (p), the Morlet wavelet analysis generated an 11 × 101 time frequency intensity matrix, denoted as Is,r,m,p(f,t), where f represents one of the 11 wavelet center frequency bands and t represents one of the 101 normalized time points. First, the total wavelet intensity of each trial was calculated by summing all values in the 11 × 101 time frequency intensity matrix:
Where Ks,r,m,p represents the total wavelet intensity for participant s, trial r, muscle m, and phase p. Second, because each participant completed three valid kicks, the participant specific scaling factor was calculated separately for each muscle and phase as the median of the three trial specific total intensities:
Where represents the unified scaling factor for participant s, muscle m, and phase p. Third, each trial level time frequency intensity matrix was normalized by dividing each matrix element by this participant specific scaling factor:
Where Ĩs,r,m,p(f,t) denotes the normalized wavelet intensity at frequency band f and normalized time point t. Finally, the normalized matrices from the three valid trials were averaged within each participant to obtain a participant level representative time frequency intensity matrix:
Where Īs,m,p(f,t) represents the participant level mean normalized intensity matrix for participant s, muscle m, and phase p. Thus, amplitude normalization was based on total wavelet intensity, was performed after wavelet transformation, and was participant-, muscle-, and phase-specific. The resulting participant-level mean matrices were used for subsequent global PCA and SPM1D analyses (von Tscharner et al., 2018; Mohr et al., 2022). Repeated trials were therefore not treated as independent observations. Group-level mean matrices were calculated only for descriptive visualization of the time-frequency heat maps. This amplitude-normalization procedure was separate from the z-score standardization applied to feature columns before PCA. As a sensitivity analysis, the PCA and SPM1D pipeline was repeated using maximum-intensity-based normalization. The main significant PC-phase findings remained unchanged, with significant clusters observed for Phase 1 PC3 and Phase 2 PC1. To characterize the dominant patterns of time-frequency intensity across muscles and frequency bands and to enable between-group comparisons, a global PCA model was constructed using the participant-level mean matrices from the whole cohort. Individual trial-level matrices were not entered into the PCA. For each participant and phase, the normalized 11 × 101 intensity matrices from the seven muscles were concatenated in a fixed order by muscle and frequency band. At each normalized time point, this yielded a 77-dimensional feature vector, corresponding to seven muscles × 11 frequency bands. The 101 time-point vectors from all participants were then stacked to construct the global feature matrix for PCA. The PCA model was built without using group labels and was used only to define a common component space for all participants. Before PCA, each feature column was z-score standardized to minimize scale differences across muscles and frequency bands. PCA was then performed to obtain a common set of spatial loadings and the associated explained variance, and the first six principal components were retained based on cumulative explained variance and interpretability. The same principal component weights were subsequently applied to each participant’s time-frequency feature data to compute the PC score time series for each component (Figure 1d). Thus, each participant contributed one representative PC score trajectory for each phase and principal component, and repeated trials were not treated as independent observations (Bro and Smilde, 2014; Jolliffe and Cadima, 2016; Shlens, 2014).
Statistical analysisTo compare between-group differences in principal component score time series across the two phases of the instep kick, the global PCA model constructed from participant-level mean matrices was used to obtain each participant’s PC score time series for both phases. The global PCA model was constructed without using group labels and was used only to define a common component space for all participants. Between-group comparisons were then performed separately for the first six principal components (PC1 to PC6). For each PC, the score trajectories of the elite and amateur groups were treated as one-dimensional continuous time signals and analyzed in a Python 3.9 environment using independent-samples t tests implemented in the open-source SPM1D package (Chen et al., 2025; Gao et al., 2025; Zhu et al., 2026). The family-wise error structure was defined across the 12 PC-phase comparisons, consisting of six PCs tested in each of the two kicking phases. Within each PC-phase comparison, SPM1D controlled the family-wise error rate across the normalized time continuum. To further control for multiple PC-phase tests, statistical significance was evaluated using a Bonferroni-adjusted threshold of α_adjusted = 0.05/12 = 0.0042. A cluster was considered statistically significant only when it exceeded the SPM1D critical threshold under this adjusted alpha level. The assumptions for independent-samples SPM1D tests were checked before statistical inference. Independence was ensured by using participant-level mean PC score trajectories, with each participant contributing one trajectory per phase and PC. The distribution of participant-level PC scores and model residuals was inspected using Q-Q plots and Shapiro-Wilk tests on cluster-mean PC scores, and homogeneity of variance between groups was assessed using Levene’s tests. No severe violations of these assumptions were observed. To examine whether the main PCA/SPM1D findings were influenced by differences in training background, sensitivity analyses were conducted for the significant SPM1D clusters. For each participant, the mean PC score within each significant cluster was extracted, including the Phase 1 PC3 cluster from 54% to 75% of normalized time and the Phase 2 PC1 cluster from 60% to 70% of normalized time. Linear regression models were then used to test whether the group effect remained after adjusting separately for training experience and weekly training volume. Certification status and competition exposure were not included as covariates because they were part of the predefined group classification criteria and were therefore highly collinear with group membership.
As shown in Figure 2, the Phase 1 heat maps provide a descriptive overview of the group level distribution of normalized wavelet intensity across muscles, frequency bands, and normalized time. Because between group inference was performed using PCA derived score trajectories, the heat maps are presented to contextualize the main time frequency regions underlying the overall EMG patterns. Participant level peak normalized wavelet intensity values and corresponding peak frequency bands are summarized in Table 3. In both groups, wavelet intensity was mainly distributed within the low to low mid frequency range, approximately 6.90 to 128.48 Hz. In the elite group, the quadriceps muscles (RF, VL, and VM) showed regions of relatively higher normalized wavelet intensity within the low frequency range during the early to middle portion of Phase 1, approximately 20 to 60% of the normalized phase. In the amateur group, the corresponding RF and VM intensity regions were mainly observed during the middle-to-later portion of the phase. For BF, the elite group showed a region of relatively higher normalized wavelet intensity during the late pre-contact period, approximately 80 to 100% of Phase 1, with intensity extending into the mid frequency range. The amateur group showed a BF distribution mainly within the lower frequency bands. For the lower leg muscles, TA, MG, and LG in the amateur group showed low frequency intensity regions during the late pre-contact period. These descriptive patterns provided visual context for the subsequent PCA based interpretation of phase specific group differences. As indicated in Figure 3, the Phase 2 heat maps showed that group mean wavelet intensity in both groups was mainly distributed within the low frequency range, approximately 6.90 to 62.09 Hz. In the amateur group, LG showed a region of relatively higher normalized wavelet intensity during the early post-contact interval, mainly within 0 to 20% of Phase 2 and within approximately 6.90 to 62.09 Hz. MG showed a low frequency intensity region during the later portion of the phase, mainly within 70 to 100% of Phase 2. In the elite group, VL and VM showed regions of relatively higher normalized wavelet intensity within the low frequency range during the early post-contact interval, mainly within 0 to 20% of Phase 2, whereas BF showed a region of relatively higher normalized wavelet intensity during the middle to later portion of Phase 2, approximately 60 to 100% of the normalized phase. Overall, the heat maps were used to describe the spatial and temporal organization of group level EMG time frequency patterns, while formal between group inference was based on the PCA derived score trajectories and SPM1D results reported in the following section. During Phase 1 of the instep kick, from maximum hip extension to ball contact, SPM1D independent samples t tests applied to the time series of the first six principal components (PC1 to PC6) showed that PC3 exhibited a significant between group difference at 54 to 75 percent of the normalized phase (p < 0.001), with higher PC3 scores in the elite group than in the amateur group within this interval (Figure 4a). During Phase 2, from post-contact follow-through to maximum hip flexion, the corresponding SPM1D tests indicated that only PC1 showed a significant between group difference, occurring at 60 to 70 percent of the normalized phase (p < 0.001), with PC1 scores significantly lower in the elite group than in the amateur group (Figure 4b). A complete summary of the SPM1D results for all PC1 to PC6 tests in each phase, including observed peak t values, critical thresholds, cluster extents, cluster-level p values, effect sizes, exact normalized window bounds, and non-significant components, is provided in Table 4. No significant intervals were detected for the other principal components. To examine whether these findings were influenced by differences in training background, sensitivity analyses were performed by extracting the mean PC scores within the significant SPM1D clusters. The group effect for the Phase 1 PC3 cluster remained significant after adjustment for training experience (p = 0.012) and weekly training volume (p = 0.018). Similarly, the group effect for the Phase 2 PC1 cluster remained significant after adjustment for training experience (p = 0.016) and weekly training volume (p = 0.023). These findings suggest that the main PCA/SPM1D results were not solely explained by between-group differences in training experience or weekly training volume. The purpose of this study was to examine differences in multi-muscle activation patterns during the instep kick between male soccer players of different competitive levels. Wavelet-based analysis and principal component analysis were applied to extract dominant surface EMG time-frequency patterns across the two kicking phases, with the aim of capturing transient, frequency specific changes in muscle activation during shooting. The results partially supported our a priori hypothesis. Across several muscles, the elite group exhibited higher intensity than the amateur group within lower frequency ranges. In Phase 1, between-group differences were mainly reflected in PC3, whereas in Phase 2 they were primarily driven by PC1. These principal components were characterized by distinct muscle and frequency-band features. In Phase 1, PC3 was mainly associated with mid- to high-frequency components of the biceps femoris, with additional contributions from lower-leg muscles. In Phase 2, PC1 was mainly associated with mid- to high-frequency components of the medial gastrocnemius. Overall, these findings suggest that competitive-level differences are not simply expressed as globally greater or lower activation. Instead, they are reflected in the redistribution of time-frequency energy across specific muscles and frequency bands within critical time windows. In the context of previous biomechanical studies, this redistribution may represent a neuromuscular activation pattern compatible with the proximal-to-distal kinetic-chain demands of soccer shooting, although the present EMG data do not directly quantify intersegmental coordination (Kellis and Katis, 2007; Nunome et al., 2006; Lees et al., 2010). In Phase 1 of the instep kick, from maximum hip extension to ball contact, the between-group differences appear to reflect distinct neuromuscular organization of proximal acceleration and distal braking during the pre-contact preparation period. The elite group showed earlier and more concentrated low- to mid-frequency high-intensity bands in the quadriceps during the early to middle portion of Phase 1, together with a more pronounced late pre-contact increase in biceps femoris intensity accompanied by frequency-band expansion (Figure 2). Consistent with these observations, PC3 showed a significant between-group difference at 54.6-75.4% of normalized Phase 1 (Figure 4a), with higher PC3 scores in the elite group. Based on the PC3 loading structure, positive PC3 scores primarily reflected a greater relative contribution of mid- to high-frequency biceps femoris intensity, together with smaller accompanying contributions from selected lower-leg muscle components. Thus, the Phase 1 PC3 difference should be interpreted as a BF-dominant time-frequency pattern rather than as a uniform increase in activation across all muscles. This pattern is consistent with the role of the hamstrings in terminal limb deceleration and knee stabilization before ball contact. The instep kick requires rapid segmental motion to generate high foot speed, as well as rapid reorganization of the control strategy near ball contact to stabilize the knee-ankle chain and standardize contact conditions. Previous studies have indicated that kicking performance depends on precise coordination of hip and knee motion timing and accurate pre-contact postural preparation (Lees et al., 2010; Nunome et al., 2006; Kellis and Katis, 2007). The between group difference in PC3 observed in Phase 1 suggests that elite and amateur players may differ systematically in how they coordinate braking and joint stabilization during the late pre-contact period. Specifically, a clearer and more temporally concentrated biceps femoris related energy pattern across frequency bands may help regulate terminal knee extension angular velocity and reduce rapid fluctuations in joint motion before contact, thereby promoting a more consistent striking surface posture and a more stable direction of force transmission at ball contact (Rabello et al., 2022). Importantly, this difference should not be interpreted simply as greater biceps femoris effort. Rather, it may reflect redistribution of frequency components within the overall surface EMG spectral structure. Although such spectral redistribution may be related to activation-dependent factors, such as motor unit firing behavior and muscle fiber conduction velocity, its interpretation should remain cautious because surface EMG frequency content can also be affected by electrode placement, tissue filtering, crosstalk, movement artifacts, muscle length, fatigue, and signal-processing choices (Solomonow et al., 1990; Wakeling and Rozitis, 2004). The Phase 2 differences complement those observed in Phase 1. After ball contact, the distal segment velocity of the swinging leg decreases rapidly, and the movement transitions into a phase of postural recovery and stability control. Accordingly, between-group differences shift from pre-contact braking organization toward post-contact stabilization demands. Compared with the elite group, the amateur group showed regions of relatively higher normalized wavelet intensity during the early post-contact period and again during the later portion of the phase, particularly in LG and MG. Consistent with these observations, PC1 showed a significant between-group difference at 60-70% of Phase 2, from post-contact follow-through to maximum hip flexion, with lower PC1 scores in the elite group than in the amateur group (Figure 4b). The MG-dominated mid- to high-frequency structure of PC1 suggests that post-contact differences are primarily expressed as divergent control demands on the ankle plantar flexor muscles. Following impact, the distal speed of the swinging leg decreases rapidly and is accompanied by the need for postural reorganization. During this process, post-contact recovery requires coordinated control of the swinging limb and whole-body posture. However, because EMG was recorded only from the kicking leg, the present findings should be interpreted as reflecting kicking-leg muscle activation patterns rather than support-leg control mechanisms (Chew-Bullock et al., 2012; Moriyama et al., 2024). A more pronounced MG-dominated frequency-band energy structure is consistent with the post-contact demands of regulating ankle stiffness and dissipating or redistributing mechanical energy. Because ball contact and the immediate post-contact window impose strong constraints on distal segment motion during shooting, control of the ankle-foot complex becomes a key factor influencing stability during the transition from impact to recovery (Lees et al., 2010; Nunome et al., 2006). This interpretation is also supported by the time-frequency heat maps. In the amateur group, the greater high-frequency wavelet intensity of the plantar flexors and hamstrings during the mid- to late post-contact period suggests a different surface EMG spectral organization during follow-through and recovery. In contrast, the elite group showed less reliance on this high-frequency-dominated pattern within the same time window. Therefore, the relative reduction or enhancement of high-frequency components should be interpreted as a difference in EMG time-frequency organization rather than as direct evidence of altered neural drive or motor unit recruitment. Because surface EMG frequency content can be influenced by both physiological and measurement-related factors, these spectral differences should be considered complementary to, rather than a replacement for, amplitude-based EMG metrics. Moreover, post-contact differences were more concentrated in patterns related to the plantar flexors than in those related to the proximal muscles responsible for early speed generation, indicating that competitive-level differences are reflected not only in speed production but also in post-contact stability control. The present findings may help generate phase-targeted hypotheses for applied training, rather than providing direct evidence for intervention efficacy or injury-risk reduction. Based on the present EMG results, the Phase 1 PC3 difference identifies a BF-dominant time-frequency pattern during the mid- to late pre-contact period, suggesting that hamstring-related braking and knee stabilization during kicking may be relevant targets for future training studies. Accordingly, future interventions could examine whether eccentric hamstring braking, terminal swing alignment control, Nordic hamstring exercise, eccentric knee flexor strengthening, and segmental swing kicking drills with or without a ball can modify kicking-specific biceps femoris activation patterns and improve pre-contact control. Although Nordic hamstring exercise and FIFA 11+ have been supported by external injury-prevention studies, the present cross-sectional EMG study did not directly test whether these interventions reduce hamstring injury risk or improve kicking performance (Petersen et al., 2011). Similarly, the Phase 2 PC1 difference suggests that plantar flexor-related time-frequency patterns during post-contact follow-through may be another candidate target for future studies. Training elements such as high-speed resisted plantar flexion, short-contact plyometric drills, ankle proprioceptive tasks, and follow-through technical cues may be explored as potential strategies to improve ankle-foot regulation and post-contact recovery (Sinulingga et al., 2025). However, whether these approaches reduce reliance on high-frequency-dominated EMG patterns, improve movement stability, or reduce injury risk remains to be tested in longitudinal intervention designs (Soligard et al., 2008; Thorborg et al., 2017; Bizzini and Dvorak, 2015; Gomes Neto et al., 2017). Overall, the present findings provide a time-frequency and multivariate EMG framework for identifying candidate neuromuscular features related to skill level, but their applied value should be confirmed in future training and injury-prevention studies. This study has several limitations. First, time-frequency characterization was based on sEMG. Surface EMG is inevitably influenced by factors such as intermuscular crosstalk, subcutaneous tissue thickness, variability in electrode placement, changes in skin impedance, and signal-processing choices. Therefore, although time- frequency intensity can reflect the time-frequency distribution of neuromuscular activation, it should not be treated as a direct surrogate for muscle force or joint moments, and observed frequency-band differences may result from both physiological and measurement-related factors. Second, the experimental task was performed under controlled indoor conditions. Standardizing shooting distance, target location, and ball settings improves repeatability but differs from the ecological demands of match play, which include opposition, fatigue, time pressure, and decision-making constraints. Future studies should therefore examine progressive ecological task constraints, such as approaching the ball under time pressure, shooting with a defender present, kicking a moving ball, performing shots after standardized fatigue protocols, or manipulating accuracy-speed trade-off demands. These constraints would be expected to affect not only ball speed and shooting accuracy but also the timing, magnitude, and variability of PCA-derived EMG time-frequency patterns. For example, time pressure and defender presence may increase variability in pre-contact preparation and alter BF-related Phase 1 PC3 patterns, whereas fatigue and moving-ball conditions may modify plantar flexor-related Phase 2 PC1 patterns during follow-through and post-contact recovery. Thus, the neuromuscular activation patterns observed in the present controlled task should be verified under constraints that more closely resemble real game situations. This study analyzed two key phases of the instep kick using Morlet wavelet-based time-frequency intensity from seven kicking-leg muscles and global PCA score trajectories. The results revealed systematic between-group differences in pre-contact preparation and post-contact follow-through control. In Phase 1, elite players showed a more temporally concentrated and phase-specific activation organization, characterized by a stabilization-related pattern with increased mid-frequency components of the biceps femoris during the mid- to late pre-contact period. In contrast, amateur players displayed a more dispersed and prolonged pre-contact energy distribution. In Phase 2, amateur players showed greater reliance on a medial gastrocnemius-related high-frequency pattern during the mid- to late post-contact period, whereas elite players showed less dependence on this plantar flexor-related pattern, suggesting a different post-contact EMG time-frequency organization. These findings should be interpreted as controlled laboratory evidence from a small male sample performing standardized indoor kicks and should be replicated in more ecological kicking tasks and more diverse participant samples.
| ACKNOWLEDGEMENTS |
This study was sponsored by National Social Science Fund of China (25BTY103). The authors have declared that there are no conflicts of interest in the authorship and publication of this contribution. The datasets generated and analyzed in this study are not publicly available, but are available from the corresponding author who organized the study upon reasonable request. All experimental procedures were conducted in compliance with the relevant legal and ethical standards of the country where the study was performed. The authors declare that no Generative AI or AI-assisted technologies were used in the writing of this manuscript. |
|
| AUTHOR BIOGRAPHY |
|
 |
Jiazhong Zhu |
| Employment: Faculty of Sports Science, Ningbo University. No. 818, Fenghua Road, Jiangbei District Ningbo, Zhejiang. China |
| Degree: BSc |
| Research interests: sports biomechanics; sports training |
| E-mail: 981429042@aliyun.com |
| |
 |
Diwei Chen |
| Employment: Faculty of Sports Science, Ningbo University. No. 818, Fenghua Road, Jiangbei District Ningbo, Zhejiang. China |
| Degree: MSc |
| Research interests: footwear biomechanics; running biomechanics |
| E-mail: 2311040040@nbu.edu.cn |
| |
 |
Dongxu Wang |
| Employment: Faculty of Sports Science, Ningbo University. No. 818, Fenghua Road, Jiangbei District Ningbo, Zhejiang. China |
| Degree: MSc |
| Research interests: footwear biomechanics; Sports training |
| E-mail: wangdongxu202309@163.com |
| |
 |
Zhanyi Zhou |
| Employment: Department of Physical Education and Sport, Faculty of Sport Sciences, University of Granada, Granada, Spain |
| Degree: MSc |
| Research interests: Biomechanics, Motor control, Sports training |
| E-mail: zhanyizhou@correo.ugr.es |
| |
 |
Yang Song |
| Employment: Faculty of Sports Science, Ningbo University. No. 818, Fenghua Road, Jiangbei District Ningbo, Zhejiang. China |
| Degree: PhD |
| Research interests: running biomechanics; musculoskeletal injury prevention |
| E-mail: songyang1@nbu.edu.cn |
| |
 |
Xuanzhen Cen |
| Employment: Faculty of Sports Science, Ningbo University. No. 818, Fenghua Road, Jiangbei District Ningbo, Zhejiang. China |
| Degree: PhD |
| Research interests: running biomechanics; computational simulation |
| E-mail: cenxuanzhen@outlook.com |
| |
 |
Gusztáv Fekete |
| Employment: Department of Materials Science and Mechanical Engineering, AUDI Hungaria Faculty of Engineering, Széchenyi István University, Győr, Hungary |
| Degree: PhD |
| Research interests: sports biomechanics; musculoskeletal injury prevention |
| E-mail: fekete.gusztav@sze.hu |
| |
 |
Monèm Jemni |
| Employment: Centre for Mental Health Research in Association with the University of Cambridge, Cambridge, United Kingdom |
| Degree: PhD |
| Research interests: football biomechanics |
| E-mail: monemj@hotmail.com |
| |
 |
Huw Wiltshire |
| Employment: Cardiff School of Sport & Health Sciences, Cardiff Metropolitan University, Cardiff, United Kingdom |
| Degree: PhD |
| Research interests: football biomechanics |
| E-mail: hwiltshire@cardiffmet.ac.uk |
| |
 |
Julien Steven Baker |
| Employment: Centre for Health and Exercise Science Research, Department of Sport, Physical Education and Health, Hong Kong Baptist University, Hong Kong, China |
| Degree: PhD |
| Research interests: sports biomechanics |
| E-mail: jsbaker@hkbu.edu.hk |
| |
 |
Yaodong Gu |
| Employment: Faculty of Sports Science, Ningbo University. No. 818, Fenghua Road, Jiangbei District Ningbo, Zhejiang. China |
| Degree: PhD |
| Research interests: sports biomechanics |
| E-mail: guyaodong@hotmail.com |
| |
 |
Dong Sun |
| Employment: Faculty of Sports Science, Ningbo University. No. 818, Fenghua Road, Jiangbei District Ningbo, Zhejiang. China |
| Degree: PhD |
| Research interests: running biomechanics; musculoskeletal injury prevention |
| E-mail: sundong@nbu.edu.cn |
| |
|
| |
| REFERENCES |
 Apriantono, T., Nunome, H., Ikegami, Y., Sano, S. (2006) The effect of muscle fatigue on instep kicking kinetics and kinematics in association football. Journal of Sports Sciences 24, 951-960. Crossref |
Bansal, G., Bhatia, D., Joshi, D., Anand, S., Tewari, R.P. (2011) Coordination between lower limb muscles in different locomotion activities. International Journal of Biomedical Engineering and Technology 6, 129-141. Crossref |
Beck, T.W., Stock, M.S., DeFreitas, J.M. (2012) Time-frequency analysis of surface electromyographic signals during fatiguing isokinetic muscle actions. Journal of Strength and Conditioning Research 26, 1904-1914. Crossref |
Bizzini, M., Dvorak, J. (2015) FIFA 11+: an effective programme to prevent football injuries in various player groups worldwide—a narrative review. British Journal of Sports Medicine 49, 577-579. Crossref |
Bro, R., Smilde, A.K. (2014) Principal component analysis. Analytical Methods 6, 2812-2831. Crossref |
Brophy, R.H., Backus, S.I., Pansy, B.S., Lyman, S., Williams, R.J. (2007) Lower extremity muscle activation and alignment during the soccer instep and side-foot kicks. Journal of Orthopaedic & Sports Physical Therapy 37, 260-268. Crossref |
Cai, J., Sun, D., Li, F., Chen, D., Zhu, J., Song, Y., Fan, Y., Goda, T.J., Gu, Y. (2026) Dose-dependent effects of heel elevation on kinetic chain reconstruction and lumbar stress during loaded squatting in men with restricted ankle dorsiflexion. Journal of Strength and Conditioning Research, . Crossref |
Cerrah, A.O., Şimsek, D., Soylu, A.R., Nunome, H., Ertan, H. (2024) Developmental differences of kinematic and muscular activation patterns in instep soccer kick. Sports Biomechanics 23, 28-43. Crossref |
Chen, D., Sun, D., Li, F., Zhou, Z., Wang, D., Wang, Y., Cen, X., Song, Y., Xu, Y., Janićijević, D., Gu, Y. (2025) Understanding lower-limb synergies and their role in angular momentum transfer: a biomechanical analysis on tennis double-handed backhand. Proceedings of the Institution of Mechanical Engineers, Part P: Journal of Sports Engineering and Technology, in press. Crossref |
Chew-Bullock, T.S.Y., Anderson, D.I., Hamel, K.A., Gorelick, M.L., Wallace, S.A., Sidaway, B. (2012) Kicking performance in relation to balance ability over the support leg. Human Movement Science 31, 1615-1623. Crossref |
Di Nardo, F., Basili, T., Meletani, S., Scaradozzi, D. (2022) Wavelet-based assessment of the muscle-activation frequency range by EMG analysis. IEEE Access 10, 9793-9805. Crossref |
Farina, D., Merletti, R., Enoka, R.M. (2004) The extraction of neural strategies from the surface EMG. Journal of Applied Physiology 96, 1486-1495. Crossref |
Faul, F., Erdfelder, E., Buchner, A., Lang, A.G. (2009) Statistical power analyses using G*Power 3.1: tests for correlation and regression analyses. Behavior Research Methods 41, 1149-1160. Crossref |
Frère, J (2017) . (2017) Spectral properties of multiple myoelectric signals: new insights into the neural origin of muscle synergies. Neuroscience 355, 22-35. Crossref |
Gao, S., Song, Y., Sun, D., Cen, X., Wang, M., Lu, Z., Gu, Y. (2025) Impact of Becker muscular dystrophy on gait patterns: insights from biomechanical analysis. Gait & Posture 121, 160-165. Crossref |
Ghosh, D.M., Swaminathan, R. (2020) Generalised Warblet transform-based analysis of biceps brachii muscles contraction using surface electromyography signals. International Journal of Biomedical Engineering and Technology 34, 305-318. Crossref |
Gomes, Neto, Conceição, C.S., de Lima, Brasileiro, de Sousa, C.S., Carvalho, V.O., de Jesus, F.L.A. (2017) Effects of the FIFA 11 training program on injury prevention and performance in football players: a systematic review and meta-analysis. Clinical Rehabilitation 31, 651-659. Crossref |
Jolliffe, I.T., Cadima, J. (2016) Principal component analysis: a review and recent developments. Philosophical Transactions of the Royal Society A: Mathematical, Physical and Engineering Sciences 374, 20150202. Crossref |
Kellis, E., Katis, A. (2007) Biomechanical characteristics and determinants of instep soccer kick. Journal of Sports Science and Medicine 6, 154-165. Pubmed |
Kovács, B., Csala, D., Sebestyén, Ö., Matlák, J., Groszmann, Á., Tihanyi, J., Petridis, L. (2023) Arm swing during vertical jumps does not increase EMG activity of the lower limb muscles. Physical Activity and Health 7, 132-142. Crossref |
Lees, A., Asai, T., Andersen, T.B., Nunome, H., Sterzing, T. (2010) The biomechanics of kicking in soccer: a review. Journal of Sports Sciences 28, 805-817. Crossref |
Mallat, S.G. (1989) A theory for multiresolution signal decomposition: the wavelet representation. IEEE Transactions on Pattern Analysis and Machine Intelligence 11, 674-693. Crossref |
Matsunaga, N., Kaneoka, K. (2018) Comparison of modular control during smash shot between advanced and beginner badminton players. Applied Bionics and Biomechanics 2018, 6592357. Crossref |
Mei, Q., Graham, M., Gu, Y. (2014) Biomechanical analysis of the plantar and upper pressure with different sports shoes. International Journal of Biomedical Engineering and Technology 14, 181-191. Crossref |
Mohr, M., von Tscharner, V., Nigg, S., Nigg, B.M. (2022) Systematic reduction of leg muscle activity throughout a standard assessment of running footwear. Journal of Sport and Health Science 11, 309-318. Crossref |
Moriyama, M., Kouzaki, M., Hagio, S. (2024) Anticipatory postural control in adaptation of goal-directed lower extremity movements. Scientific Reports 14, 4142. Crossref |
Nunome, H., Ikegami, Y., Kozakai, R., Apriantono, T., Sano, S. (2006) Segmental dynamics of soccer instep kicking with the preferred and non-preferred leg. Journal of Sports Sciences 24, 529-541. Crossref |
Peacock, J.C.A., Ball, K. (2018) The influence of joint rigidity on impact efficiency and ball velocity in football kicking. Journal of Biomechanics 71, 245-250. Crossref |
Petersen, J., Thorborg, K., Nielsen, M.B., Budtz-Jørgensen, E., Hölmich, P. (2011) Preventive effect of eccentric training on acute hamstring injuries in men’s soccer: a cluster-randomized controlled trial. The American Journal of Sports Medicine 39, 2296-2303. Crossref |
Rabello, R., Bertozzi, F., Galli, M., Zago, M., Sforza, C. (2022) Lower limbs muscle activation during instep kick in soccer: effects of dominance and ball condition. Science and Medicine in Football 6, 40-48. Crossref |
Shi, S., Ni, X., Ieong, L., Li, L., Liu, Y. (2025) Comparison of time-frequency characteristics of lower limb EMG signals among different foot strike patterns during running using the EEMD algorithm. Life 15, 1386. Crossref |
Shlens, J. (2014) A tutorial on principal component analysis. arXiv 1404.1100. |
Sinclair, J., Taylor, P.J., Hobbs, S.J. (2013) Digital filtering of three-dimensional lower extremity kinematics: an assessment. Journal of Human Kinetics 39, 25-36. Crossref |
Sinulingga, A.R., Slaidiņš, K., Salajeva, A., Liepa, A., Pontaga, I. (2025) Effect of integrative balance and plyometric training on balance, ankle mobility, and jump performance in youth football players: a randomized controlled trial. Physical Activity and Health 9, 146-160. Crossref |
Soligard, T., Myklebust, G., Steffen, K., Holme, I., Silvers, H., Bizzini, M., Junge, A., Dvorak, J., Bahr, R., Andersen, T.E. (2008) Comprehensive warm-up programme to prevent injuries in young female footballers: cluster randomised controlled trial. BMJ 337, a2469. Crossref |
Solomonow, M., Baten, C., Smit, J., Baratta, R., Hermens, H., D’Ambrosia, R., Shoji, H. (1990) Electromyogram power spectra frequencies associated with motor unit recruitment strategies. Journal of Applied Physiology 68, 1177-1185. Crossref |
Thorborg, K., Krommes, K.K., Esteve, E., Clausen, M.B., Bartels, E.M., Rathleff, M.S. (2017) Effect of specific exercise-based football injury prevention programmes on the overall injury rate in football: a systematic review and meta-analysis of the FIFA 11 and 11+ programmes. British Journal of Sports Medicine 51, 562-571. Crossref |
Torrence, C., Compo, G.P. (1998) A practical guide to wavelet analysis. Bulletin of the American Meteorological Society 79, 61-78. Crossref |
Triwiyanto Wahyunggoro, O., Nugroho, H.A. (2017) . (2017) Continuous wavelet transform analysis of surface electromyography for muscle fatigue assessment on the elbow joint motion. Advances in Electrical and Electronic Engineering 15, 424-434. Crossref |
von Tscharner, V. (2000) Intensity analysis in time-frequency space of surface myoelectric signals by wavelets of specified resolution. Journal of Electromyography and Kinesiology 10, 433-445. Crossref |
von Tscharner, V., Ullrich, M., Mohr, M., Comaduran Marquez, D., Nigg, B.M. (2018) A wavelet-based time-frequency analysis of electromyograms to group steps of runners into clusters that contain similar muscle activation patterns. PLOS ONE 13, e0195125. |
Wakeling, J.M., Rozitis, A.I. (2004) Spectral properties of myoelectric signals from different motor units in the leg extensor muscles. Journal of Experimental Biology 207, 2519-2528. Crossref |
Wang, D., Song, Y., Sun, D., Li, F., Chen, D., Zhou, Z., Zhang, Q., Cen, X., Kovács, B., Gao, Z., Xiang, L., Gu, Y. (2026) Biomechanical trade-offs in knee brace stiffness: dynamic stability during single-leg lateral landings in young males. IEEE Transactions on Neural Systems and Rehabilitation Engineering 34, 626-637. Crossref |
Watanabe, K., Nunome, H., Inoue, K., Iga, T., Akima, H. (2020) Electromyographic analysis of hip adductor muscles in soccer instep and side-foot kicking. Sports Biomechanics 19, 295-306. Crossref |
Zhang, L., Zhang, M., Liu, H. (2025) Inter-segmental coordination during soccer instep kicking: a vector-coding comparison between experienced athletes and novices. Bioengineering 12, 1151. Crossref |
Zhou, Z., Gao, Z., Li, F., Wang, D., Wang, Y., Fekete, G., Gu, Y. (2025) Comparison of interlimb coordination during soccer instep kicking between elite and amateur players. European Journal of Sport Science 25, e70041. Crossref |
Zhou, Z., Li, S., Yang, L., Gao, Z., Lin, Y., Radak, Z., Gu, Y. (2023) Inter-segmental coordination of the swimming start among Paralympic swimmers: a comparative study between S9, S10, and S12 swimmers. Applied Sciences 13, 9097. Crossref |
Zhu, J., Sun, D., Cai, J., Li, W., Hu, C., Lu, Z., Song, Y., Cen, X., Jemni, M., Gu, Y. (2026) Comparative analysis of knee and ankle joint biomechanics during single-leg landing in bilateral lay-ups: influence of hand dominance in basketball players. International Journal of Sports Science & Coaching, . Crossref |
Zhu, J., Sun, D., Cai, J., Yang, X., Li, W., Lu, Z., Hu, C., Song, Y., Cen, X., Jemni, M., Gu, Y. (2025) Etiology-specific ankle dorsiflexion limitation reorganizes stance-phase biomechanics during barefoot gait: a time-resolved SPM1D and EMG study. Acta of Bioengineering and Biomechanics 27, 57-68. Crossref |
|
| |
|
|
|
|