|
|
|
| |
| ABSTRACT |
|
This study aims to identify the stroke mechanics regulations that underlie pacing optimization and differentiate final performance in the 400 m front-crawl across different performance levels. 157 all-out 400 m trials from trained to elite swimmers equipped with a sacrum worn IMU were analyzed. Hierarchical generalized additive models were fitted to describe (1) the technical predictors of final performance, through the interrelationships between averaged kinematics (i.e., stroke rate (SR), stroke length (SL), jerk cost (JC)) and mean speed, and (2), the profiles of pacing and associated stroke mechanics regulations leading to performance. These models depict both the common patterns shared by all swimmers and the specific group deviations by performance level (G1 -slowest- to G4 -fastest-) from population trends. All swimmers shared a reverse-J-shaped pacing (p < 0.001). The fastest swimmers reduce pacing variability with a relatively slower start, a minimized drop in speed in the middle of the race, and a greater end-spurt than the population trend (p < 0.05). Their stroke mechanics are effectively adapted to the requirements of such specific race sections, both through a U-shaped JC with higher magnitude (p < 0.001) and a continuous adaptation of the SR (p < 0.01) and SL (p < 0.01) combination. A high average SL (i.e., at least 1.50 m.stroke-1), coupled with an SR close to 70 strokes.min-1 and maximizing stroke smoothness at race pace, are critical technical abilities for optimizing final performance. Technical training should prioritize the reduction of intra-cyclic acceleration variations at race pace as a key driver of 400 m performance development. The best performers lower pacing variability by amplifying the magnitude of kinematic regulations, particularly in terms of stroke smoothness management. Such underlying adaptations in stroke mechanics play a pivotal role in continuous speed control throughout the race. The findings of this study enhance the technical understanding of discriminative 400 m pacing skills for coaches and swimmers. |
| Key words:
Swimming, kinematics, modeling, performance analysis, stroke smoothness
|
Key
Points
- Technical understanding of distinguishing pacing skills in the 400 m freestyle is enhanced by highlighting the associated regulations of stroke mechanics, providing insights for performance development.
- Pacing strategy and final performance are underpinned by effective stroke smoothness management and a continuous adaptation of the stroke rate (SR)-stroke length (SL) combination, tailored to the demands of specific race sections.
- An average SL of 1.50 m.stroke coupled with an SR close to 70 strokes.min and maximizing stroke smoothness at race pace are critical kinematic abilities.
|
Pacing strategies are associated with the subsequent appropriate management of energy expenditure during exercise and substantially impact sports performance (Abbiss and Laursen, 2008). In swimming, effective pacing is especially important due to the resistive properties of water, which result in low mechanical efficiency (Zamparo et al., 2020). Consequently, adequate pacing may be more important in swimming than in land-based sports, and its optimization represents a crucial step towards elite performance (Menting et al., 2023). However, helping swimmers to create their individual performance template (Foster et al., 2009) requires an understanding of their pacing behavior (McGibbon et al., 2020). In this sense, the effectiveness of pacing appears to be highly dependent on the underlying swimming technical abilities that allow for the continuous and essential refinement of stroke mechanics throughout long-distance pool race (Bouvet et al., 2025). Therefore, assessing stroke mechanics (e.g., length and frequency) in relation to swimming speed and expertise seems to be of paramount importance to improve the comprehension of discriminative pacing skills. This necessitates a more detailed investigation of the ongoing regulation of stroke mechanics that drives the fine-tuning of pacing. In the 400 m freestyle, previous research has identified a specific pacing pattern described as parabolic or fast-start and even profile, in both elite (Taylor et al., 2016; Zacca et al., 2019; Skorski et al., 2014; Barroso et al., 2021) and age-group swimmers (Tijani et al., 2021). Even pacing, which maintains speed throughout the race, seems to be a valuable strategy, as it would be beneficial to minimizes drag and conserves energy for a strong final end-spurt (McGibbon et al., 2018). More generally, for 400 m and longer races, conserving energy at the start and maintaining a steady pace through the mid-sections, followed by a speed increase, is crucial for success (Morais et al., 2019; Lipinska et al., 2016b). Nevertheless, while successful pacing strategies have been identified in middle and long-distance swimming (Demarie et al., 2023), there is a critical lack of kinematic explanations of these strategies in terms of the underlying and essential regulation of stroke mechanics. Therefore, pacing strategies should be evaluated in the light of the associated mechanisms of technical regulation that continuously adapt stroke mechanics during the race. However, the continuous regulation of stroke mechanics underlying pacing behavior remains unclear, and the biomechanical mechanisms involved can only be speculated upon (Demarie et al., 2023), limiting our technical understanding of effective pacing strategies. Previous studies have shown that the ability to maintain swimming speed, based on stroke rate (SR) or stroke length (SL), directly and positively impacts performance (Lipinska, 2011). However, studies on kinematic patterns of middle and long-distance swimmers have mainly focused on split times and limited performance levels (Lipinska and Hopkins, 2020; Lipinska et al., 2016a). Moreover, small sample sizes have hindered comparisons between performance groups (Correia et al., 2020) and weakened the robustness of inferential statistical analysis (Correia et al., 2023), leading to sparse data modeling. This has led to limited technical insights in terms of stroke mechanics regulation and performance analysis across a broad range of expertise levels. Regarding the 400 m freestyle, the kinematic description and quantitative summary that supports the comprehension of which parameters reflect actual performance, has not yet been explored (Correia et al., 2023). While it has been shown that a higher SR, despite a reduced SL, helps swimmers maintain or increase speed towards the end of the race (Strzała et al., 2007), few studies have linked stroke mechanics to pacing across different performance groups. This gap in knowledge restricts the kinematic understanding of pacing profiles in terms of stroke mechanics and specific swimmers' performance levels (Morais et al., 2019). Therefore, in order to profile the technical regulations and stroke patterns underlying pacing and differentiating 400 m performance, establishing kinematic benchmarks from a large database of stroke mechanics seems to be of utmost importance. In addition to SR and SL, jerk cost (JC) also provides valuable insights into technical abilities and can be an important indicator for monitoring swimming performance and expertise. JC quantifies stroke smoothness, a universal characteristic of skilled and efficient movement that can be used as a window into motion proficiency (Kiely et al., 2019). This stroke mechanics metric has recently been applied to a variety of swimming events, ranging from the 50 m freestyle to the 10 km open-water event. It has been used to evaluate sprint technique (Ganzevles et al., 2023), discriminate biomechanical abilities (Bouvet et al., 2024), assess pacing effectiveness in 5 km pool swimming (Bouvet et al., 2025), and profile stroke regulations associated with open-water success (Bouvet et al., 2023). Although interpretations of JC are event-specific and therefore not generalizable due to differing constraints and evolving performance determinants, combining it with conventional stroke parameters could reveal the kinematic prerequisites that underpin optimal 400 m pacing. Specifically, it may improve the comprehension of the interactions between stroke mechanics regulation and pacing, while facilitating the development of pacing skills by highlighting the related technical abilities. The objective of this study was to analyze the continuous interrelationships between stroke mechanics regulation and pacing optimization in the 400 m freestyle across different performance levels, with the ultimate aim of identifying the technical requirements that underlie pacing and differentiate final performance. ParticipantsA total of 127 subjects (49 women, age: 18.7 ± 6.39 y.o.; height: 164 ± 7.47 cm; mass: 54.8 ± 8.31 kg; 78 men, age: 22.9 ± 8.89 y.o.; height: 179 ± 7.67 cm; mass: 66.8 ± 8.57 kg) were included in this study and were classified according to Ruiz-Navarro et al., (2023): level 5 (n = 74, 400 m freestyle short-course best performance: 5’53 ± 58”3, World Aquatics Points: 297 ± 95.4), level 4 (n = 49, 400 m freestyle short-course best performance: 4’29 ± 13”1, World Aquatics Points: 548 ± 51.2), level 3 (n = 3, 400 m freestyle short-course best performance: 4’00 ± 2”41, World Aquatics Points: 691 ± 20.8) and level 2 (n = 1, 400 m freestyle short-course best performance: 3’47). All participants provided informed consent in accordance with the French Ethical Committee (approval reference 2021-A00250-41).
Data collectionData were collected during a 400 m all-out front-crawl wall start in a 25 m pool. Swimmers competed in heats of 3 to 6 athletes of similar ability in separate lanes, allowing head-to-head racing. The final dataset includes 157 trials (96 men, 61 women). Eighteen swimmers performed 2 trials, and 4 swimmers performed 3 trials, resulting in an averaging of 1.24[1.15;1.33] ± 0.51 trials per swimmer, with each trial separated by at least 6 months. Participants wore a waterproof 3D IMU (Xsens DOT, Xsens Technologies B.V, Enschede, The Netherlands) sampled at 60 Hz, with the accelerometer set to 16 g and the gyroscope to 1000 deg.s-1. The sensor was attached to the sacrum with double-sided tape and secured with waterproof medical adhesive (Tegaderm, 3M, Cergy-Pontoise, France). The IMU defined a coordinate system with the x-axis pointing cranially, y-axis laterally, and z-axis posteriorly.
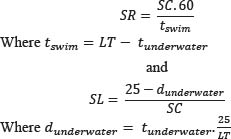
Data processingParticipants were divided by sex into quartiles based on their final time, resulting in four balanced performance groups. G1 consisted of 40 swimmers (16 women: age: 19.2±8.12 y.o.; height: 157 ± 12.2 cm; mass: 49.2 ± 8.57 kg, and 24 men: age: 23.8 ± 11.4 y.o.; height: 168 ± 12.0 cm; mass: 55 ± 12.8 kg), G2 (women: age: 18.8 ± 6.28 y.o.; height: 162 ± 8.85 cm; mass: 53 ± 11.2 kg, men: age: 24.0 ± 9.42 y.o.; height: 169 ± 9.15 cm; mass: 59.8 ± 11.1 kg), G3 (women: age: 19.4 ± 7.48 y.o.; height: 169 ± 4.73 cm; mass: 65.0 ± 5.00 kg, men: age: 22.5 ± 7.09 y.o.; height: 174 ± 6.37 cm; mass: 67.7 ± 5.82 kg), and G4 (women: age: 17.2 ± 1.32 y.o.; height: 168 ± 2.50 cm; mass: 59.5 ± 2.65 kg, men: age: 19.3 ± 3.33 y.o.; height: 180 ± 5.07 cm; mass: 68.2 ± 4.60 kg) had each 39 swimmers (15 women, 24 men). Average speeds for the groups were 1.00[0.97;1.04] ± 0.11 m.s-1, 1.19[1.17;1.21] ± 0.06 m.s-1, 1.27[1.25;1.29] ± 0.06 m.s-1 and 1.38[1.35;1.42] ± 0.10 m.s-1, corresponding to final time of 6’44 ± 46”5, 5’37 ± 17”2, 5’15 ± 15”4 and 4’51 ± 21”3. Raw IMU data were filtered using a second-order Butterworth low-pass filter with a 10 Hz cut-off frequency. The algorithm from Delhaye et al., 2022 was used for human activity recognition and to compute swimming speed based on lap time (LT) assessment over each 25 m pool length. For each lap, stroke count (SC) was identified through a zero-crossing on the mediolateral acceleration, filtered with a second-order Butterworth band-pass filter between 0.1 and 1 Hz (Ganzevles et al., 2023). SR and SL were expressed in strokes.min-1 and m.stroke-1 (note that two strokes equal one cycle), respectively, and computed as follows:
Note that t_swim and t_underwater are assessed using the human activity recognition model from Delhaye et al., (2022) and represent the duration of the front-crawl phase and underwater phase, respectively, while d_underwater refers to the distance traveled during the underwater phase.
Finally, JC was calculated as the lap average of the squared jerk signal derived from the acceleration Euclidean norm after applying a second-order Butterworth band-pass filter between 0.1 and 5 Hz (Ganzevles et al., 2023). A low JC indicates a smooth stroke pattern, while a high JC suggests a jerky one.
Statistical analysisStatistical analyzes were performed using RStudio (Version 4.2.2, RStudio, Inc., Boston, MA, USA). The significance level was set at p < 0.05. Data are presented as mean ± standard deviation per 50 m and averaged over 400 m, with 95% confidence intervals indicating uncertainty. Pairwise comparisons using t-test and Bonferroni correction were used to assess differences between performance groups. Effect size, which indicated the magnitude of differences, was interpreted using Cohen’s d, with thresholds of 0.20, 0.50, and 0.80 for trivial, small, medium, and large effects, respectively (Cohen, 1988). To adequately describe pacing skills and the underlying profiles of technical regulations, it is necessary to analyze time-series of stroke mechanics parameters (i.e., speed, SR, SL, and JC) while preserving their functional form through functional data analysis. Additionally, the data analysis pipeline should model flexible and specific relationships that may vary across performance groups (i.e., modeling intergroup variability), and assess whether a global relationship holds for all swimmers. Hierarchical Generalized Additive Models (HGAMs) were used for this purpose and fitted using the mgcv R package (Wood, 2011; 2017). These models show how kinematics evolve continuously in the whole database (i.e., common functional response) and how they vary between performance groups (i.e., specific deviations from the common functional response) (Pedersen et al., 2019).
Kinematic determinants of final 400 m performanceHGAMs were used to describe and compare the relationships between each averaged kinematic variable and final performance in G1 to G4. HGAM models non-linear functional relationships between covariates (i.e., averaged stroke mechanics: SR, SL, JC) and outcome (i.e., average swimming speed), with function shape varying between performance groups (Pedersen et al., 2019). The models provide a simultaneous representation of the relationship between stroke mechanics and 400 m performance, for the whole database and the four performance groups, by modeling both common functional responses (i.e., population trends) and intergroup variability (group-specific deviations).
Stroke mechanics and pacing regulations throughout the 400 mTo evaluate and compare pacing profiles (i.e., speed management) and underlying technical regulation mechanisms over the 400 m in G1 to G4, HGAMs were fitted with speed or stroke mechanics variables as a function of laps. The continuous evolution of kinematics during the 400 m was then described, modeled based on the common functional response shared by all swimmers (i.e., population trend) and intergroup variability, characterized by specific deviations according to performance groups.
Model specificationsTo capture both the global functional response shared by the entire population, as well as group-specific deviation effects, we fitted HGAMs under the GI formulation described by Pedersen et al. (2019). Then, intergroup variability was modeled as individual partial effects, applying penalties separately to each smoother. This resulted in each smoother having its own smoothing parameter and wiggliness level. Parameters were estimated using restricted maximum likelihood, balancing model fit against excessive complexity (i.e., assessed through the effective degrees of freedom of the smoother), to ensure an optimal trade-off between flexibility and overfitting. The smooth terms were expressed as thin-plate regression splines with 10 basis functions (Wood, 2003), and the penalty matrix was based on the integral of the squared first derivatives (Wood, 2017). A random effect for the intercept was added to improve model deviance explained (![]() ). Model interpretation was based on the significance of global and group-level smooth terms, as well as the random intercept, assessed through F-tests and visualizations of the fitted models, including smooth terms (i.e., summed effect) and/or component smooth functions (i.e., partial effect), allowing classification by curve shape (Taylor et al., 2016; Casado et al., 2021). ). Model interpretation was based on the significance of global and group-level smooth terms, as well as the random intercept, assessed through F-tests and visualizations of the fitted models, including smooth terms (i.e., summed effect) and/or component smooth functions (i.e., partial effect), allowing classification by curve shape (Taylor et al., 2016; Casado et al., 2021).
Speed, SR, SL and JC over 50m laps by performance group and pairwise comparisons are shown in Figure 1. Table 1 presents these data averaged over the 400 m. Relations between average stroke mechanics and final performanceFigure 2 presents the modeled relationships (i.e., summed effect) between final performance and mean stroke mechanics (i.e., SR, SL, JC) for each performance group. These models had ![]() values of 0.77, 0.85 and 0.77, respectively. values of 0.77, 0.85 and 0.77, respectively. The relationship between final performance and SR across all swimmers showed a non-significant negative linear association (F(1.23) = 0.35, p = 0.75; panel A in Figure 2). Despite this non-significant trend, G4 exhibited an interesting deviation from the global relationship, with performance maximization occurring around 70 strokes.min-1 (F(4.39) = 2.03, p = 0.33; red color in panel A of Figure 2). Additionally, the random group intercept was significant (F(2.98) = 129, p < 0.001), as indicated by the significantly lower mean SR in G2 compared to G3 (see Table 1). The population trend of the relationship between final performance and SL described a significant logistic shape (F(3.68) = 25.1, p < 0.001; panel B in Figure 2), with inflection points at 1.25 and 1.50 m.stroke-1, and no specific deviation in any of the four performance groups. Furthermore, the random group intercept was significant (F(2.97) = 89.4, p < 0.001), as confirmed by the significantly lower mean SL in G1 compared to G2, and G3 compared to G4 (see Table 1). The relationship between final performance and JC, consistent across the entire database, exhibited a significant linear positive association (F(1.00) = 6.00, p < 0.05; panel C in Figure 2). Additionally, a significant group-specific deviation was observed for G1 (F(3.56) = 17.2, p < 0.05; green color of panel C in Figure 2). This deviation tends to mitigate the common population trend, as evidenced by a flatter slope of the performance-JC function, with a notable performance maximization area around 11 g2.s-2x10⁻³. Moreover, the random group intercept was significant (F(2.97) = 83.9, p < 0.001), as substantiated by the significantly lower mean JC in G2 compared to G3 (see Table 1).
Pacing and regulations of underlying stroke mechanicsFigure 3 presents the common population trend and the specific deviations by performance group (i.e., partial effects) for pacing and the associated stroke mechanics regulation over 400 m. The respective ![]() values for the models were 0.93 for pacing, 0.89 for SR, 0.92 for SL, and 0.85 for JC. values for the models were 0.93 for pacing, 0.89 for SR, 0.92 for SL, and 0.85 for JC. A significant reverse-J-shaped profile was highlighted as the population trend for pacing (F(8.06) = 197, p < 0.001, panel A in Figure 3). A significant deviation from this common pattern was observed for G3 (F(3.70) = 1.96, p < 0.001, blue color of panel A in Figure 3). Specifically, G3 swimmers followed the shared reverse-J-shaped pacing with a rightward shift in their speed curve until 200 m, but then deviated from the population trend, maintaining a relatively lower speed than expected compared to the common pacing profile for the remainder of the 400 m. Interestingly, a significant opposite deviation was observed for G4 (F(1.85) = 0.69, p < 0.05, red color of panel A in Figure 3), resulting in a more balanced pacing between the two halves of the 400 m. A significant reverse-J-shaped profile was identified as the common population trend in the SR regulation across the 400 m (F(8.37 = 82.2, p < 0.001, panel B in Figure 3). Notably, significant opposite deviations were observed for G1 (F(5.54) = 2.97, p<0.001, green color of panel B in Figure 3) and G4 (F(2.17) = 0.90, p < 0.01, red color of panel B in Figure 3). Indeed, G1 swimmers mitigated the global reverse-J-shaped pattern, adopting a more stable SR profile (i.e., relatively higher SR up to 225 m, followed by a relatively lower SR compared to the shared profile). In contrast, G4 swimmers exacerbated the population trend, resulting in greater variations in SR regulation throughout the 400 m. A significant positive profile (i.e., a reduction pattern) was found as the common population trend in the regulation of SL across the 400 m (F(8.36) = 77.0, p < 0.001, panel C in Figure 3). Strikingly, significant opposite deviations were again observed for G1 (F(5.97) = 5.09, p < 0.001, green color of panel C in Figure 3) and G4 (F(5.20) = 1.71, p < 0.01, red color of panel C in Figure 3). The fitted values of the group-level smoother indicate that G1 swimmers started the 400 m with a relatively elevated SL during the first two laps. They then decreased their SL until 250 m, before finally increasing it towards the end of the race, compared to the expected values defined by the population trend (see the green curve shape in panel C of Figure 3). In contrast, G4 swimmers exhibited an almost opposite pattern: they moderated both the high SL expected in the early laps and the SL reduction observed in the common profile until 350 m, and then accentuated the shared SL decrease in the final 50 m (see the red curve shape in panel C of Figure 3). Furthermore, G3 swimmers demonstrated a significant deviation, characterized by a steeper decline in SL over the 400 m (F(2.01) = 0.73, p < 0.05, blue color of panel C in Figure 3). This led to increased variation in SL regulation for G3 swimmers, with both higher and lower SL values than expected from the population trend in the first and second halves of the race, respectively. A significant U-shaped profile was identified as the common population trend in JC regulation over the 400 m (F(8.03) = 50.5, p < 0.001, panel D in Figure 3). It is noteworthy that a significant deviation from the global trend was observed exclusively for G4 (F(6.49) = 7.30, p < 0.001, red color of panel D in Figure 3), characterized by a pronounced steepening of the U-shaped JC regulation.
This study aimed to investigate the continuous regulation of underpinned stroke mechanics in relation to pacing patterns in 400 m freestyle across different performance levels. To achieve this, a hierarchical functional data analysis framework was applied to a comprehensive database of kinematic time-series. This research identified both common trends (i.e., shared by all swimmers), and specific group-level deviations, providing insights into the kinematic determinants of 400 m performance, related pacing strategies, and the associated continuous stroke mechanics regulation throughout the race. Although this study was conducted under training conditions rather than in official 400 m competitions, it contributes to two key issues in swimming. First, it advances the technical understanding of discriminative pacing skills in the 400 m freestyle. Second, it provides valuable stroke mechanics benchmarks from simulated races with in-water starts, which may help coaches design tailored training plans and inform the elaboration of race strategies. Kinematic predictors of performanceThe relationship between SL and speed indicated an increasing influence of average SL on final performance. Similarly, mean SL increased significantly from G1 to G2 and from G3 to G4, emphasizing its importance in middle-distance front-crawl events (Costill et al., 1985). At shorter distances, swimmers racing under 50 seconds in the 100 m freestyle exhibited longer SL than those over 50 seconds (Pla et al., 2021). The logistic SL-performance curve demonstrated two inflection points that define benchmarks of averaged SL on performance. In the range below 1.12 m.stroke-1, an increase in SL was largely beneficial to the final 400 m performance. Interestingly, the average SL of the G1 swimmers (i.e., 1.09 m.stroke-1) closely matched this first inflection point, suggesting that improving swimming technique to increase SL to 1.12 m.stroke-1 would be a key primary training goal to improve 400 m performance in this group of lower performers. Such an increase in SL may be related to technical improvements in propulsive ability (Havriluk, 2009). From 1.12 to 1.50 m.stroke-1, the effect of increasing SL on performance gains remained positive but to a lesser extent (i.e., the slope of the SL-speed curve was attenuated). This may indicate that underlying technical factors (e.g., production of high pressure drag (Vorontsov and Rumyantsev, 2000), insufficient amount of propulsion generated to overcome such high drag (Craig et al., 1985)) may be disrupting this relationship. Moreover, it is striking that the mean SL of G2 (i.e., 1.27 m.stroke-1) was not significantly different from that of G3 (i.e., 1.30 m.stroke-1), indicating that switching from third to second performance quartile then relying on the evolution of other stroke mechanics parameters (e.g., SR and JC as discussed below). Finally, above the second inflection point at 1.50 m.stroke-1, further increases in SL lead to substantial improvements in performance. However, only 17 male swimmers in the whole database (i.e., 3 from G2, 4 from G3 and 10 from G4) are able to achieve such a range of averaged SL values. Furthermore, the generation of swimming speed by increasing the distance per cycle is an effective kinematic regulation, as it is associated with a small increase in energy cost (C) and then energy saving (Barbosa et al., 2008). Therefore, the ability to reach at least an average SL of 1.50 m.stroke-1 seems to be one of the decisive characteristics of stroke mechanics to maximize performance in 400 m races, and then an ongoing purpose to guide training. This could be explained by the crucial interest in targeting arm stroke efficiency for 400 m performance, which is directly related to SL and inversely related to the SR (Peterson Silveira et al., 2019). In this sense, the relationship between SL and final performance should be interpreted together with SR, as their interplay defines speed production through an optimal combination (Morais et al., 2023a). SR only differed significantly between G2 and G3. This showed that such an increase in SR may allow for performance improvements (Huot-Marchand et al., 2005), while the population trend of the partial effect of SR on overall 400 m performance was negative. Although this trend was not significant, it reinforces the idea that a polarized mechanical stroke profile (i.e., relatively high SL and low SR for a given speed) should be a targeted technical skill during training sessions. Moreover, such a technical adaptation seems to be the preferred average kinematics to maximize 400 m performance. Indeed, an increase in swimming speed based on a higher SR leads to a higher C (Komar et al., 2012). In this sense, the discriminant ability of G4 swimmers to have a non-significant SR than G3 swimmers, despite better performance and higher SL, illustrates a desired reorganization of stroke mechanics, with potentially relevant implications for C (Zamparo et al., 2020). Interestingly, the better performers exhibited a specific deviation from the population trend with an optimal frequency range around 70 strokes.min-1. Despite this deviation was not significant, such a value can be used as a data-driven benchmark to orient training. Indeed, on average, aiming for the higher possible SL for a SR of around 70 strokes.min-1 appeared to be the optimal range for maximizing 400 m performance. Such technical management of stroke mechanics may lead to faster swimming, which can be explained by the propulsion generated by the swimmers. More precisely, by maintaining a given propulsion intensity throughout the underwater phase of the stroke cycle, this can lead to a longer SL, while maintaining or slightly increasing the average SR (Morais et al., 2022). Global JC has an increasing impact on swimming performance, with averaged values rising significantly between G2 and G3, supporting findings that higher JC can enhance speed, with adequate technical skills (Ganzevles et al., 2023). Increase JC, however, is associated with greater intra-cyclic accelerations fluctuations. While a jerky stroke pattern may reflect higher force application in water, it also results in increased energy expenditure (Fernandes et al., 2023). Thus, targeting performance improvement solely through JC increases may be counterproductive, as it risks reduced stroke efficiency (i.e., C impairing) and unsustainable metabolic power demands (Zamparo et al., 2020), ultimately compromising 400 m performance. In that sense, stroke smoothness, which was not significantly different within G1-G2 and G3-G4 groups, underscores the critical role of technical ability (i.e., distinctive “feeling of the water” (Leblanc et al., 2007)) to convert intra-cyclic accelerations into speed, reflecting a proficient movement (Kiely et al., 2019). This skill appears particularly important for enhancing 400 m performance across both lower (i.e., G1-G2) and higher (G3-G4) groups. Such discriminative power of mechanical efficiency aligns with findings on higher stroke smoothness in optimal performers in 5 km (Bouvet et al., 2025) and top international open-water rankings (Bouvet et al., 2023). Therefore, technical training should prioritize smooth stroke patterns at race pace as a key driver in performance development.
Pacing and stroke mechanics regulations leading to performanceAll performance groups exhibited a reverse-J-shaped pacing pattern, consistent with the parabolic strategy reported in the literature (Taylor et al., 2016; Mauger et al., 2012; Barroso et al., 2021; McGibbon et al., 2018). G3 swimmers showed a greater speed variability than the population trend, by accentuating the fast start and mitigating the magnitude of the end-spurt. This overstated fast-start may lead to excessive accumulation of fatigue causing deterioration in mechanical efficiency and drag increase (Mytton et al., 2014). Such an aggressive pacing strategy then appears sub-optimal, as a large end-spurt is an important factor in 400 m performance and is allowed by a control at the start of the race (Mytton et al., 2015). In contrast, G4 swimmers adopted a more conservative strategy, reducing speed fluctuations throughout the race. Consequently, this relatively slower start directly increases their end-spurt ability during final laps, compared to the population trend. This finding is consistent with the literature on middle and long-distance freestyle, where a fast start strategy is detrimental (McGibbon et al., 2018). The ability of G4 swimmers to reduce the global speed drop in the middle of the race (i.e., towards a U-shaped pacing) seems appropriate, as the 100 m to 300 m laps are most strongly related to performance (Robertson et al., 2009). Such a reduction in pacing variability helps to conserve energy to launch a substantial end-spurt and maximize 400 m performance. Pacing consistency therefore appears to be a discriminative skill of higher performers that needs to be targeted during training. In that respect, one may wonder what technical regulations support this effective pacing. Across the population, SR over 400 m mirrors speed, following a reverse-J-shaped profile. Thus, SR increases sustain velocity maintenance, as demonstrated in elite 800 m freestyle (Morais et al., 2019). However, the lowest and highest performers deviate from the shared pattern in opposite ways. Slowest swimmers exaggerate high SR at the start, but mitigate its progressive increase mid-race, resulting in a relatively lower SR than the population trend. Conversely, fastest swimmers adopt a relatively reduced SR at the start, followed by a pronounced increase after 250 m compared to the common regulation, enabling their substantial end-spurt. This strategy, supported by their greater SL, helps to preserve C by delaying fatigue-related deterioration in stroke mechanics (Zamparo et al., 2020). The opposing deviations in SR profiles, with respect to the global pattern, highlight the critical role of SR regulation in 400 m performance. This aligns with the identification of SR as the primary determinant of clean swimming speed in the 1500 m freestyle (Morais et al., 2023b), and the ability of elite 400 m swimmers to increase SR throughout the last 300 m to sustain speed as much as possible (Laffite et al., 2004). Hence, the expression of an exacerbated SR reserve up to 250 m supports successful pacing and differentiates higher performers. This kinematic skill, previously identified in open-water swimming (Bouvet et al., 2023), provides valuable technical benchmarks for swimmer performance development and reinforces the importance of widely manage SR to support successful pacing. Furthermore, regulating SL throughout the race is also essential to achieve desired pacing and final performance. The common trend reveals an ongoing decline in SL throughout the race (i.e., all-out profile), which may be attributed to fatigue-induced impairments in effective force application in the water (Ruiz-Navarro et al., 2020). As a consequence, it results in a progressive decline of the arm actions effectiveness through decreases of Froude efficiency (Peterson Silveira et al., 2017). Like SR regulation, the highest and lowest performers exhibit opposing deviations from this population trend, particularly during the final 50 m. Slowest swimmers mitigate the SL decline, while fastest swimmers accentuate it compared to the global pattern. Although counterintuitive, as SL is a key determinant of swimming performance, this highlights the importance of continuously adjusting SR-SL combination across the race (Morais et al., 2023a), aligning with pacing expectations of particular race sections (Bouvet et al., 2025). This finding supports prior research showing that SL maintenance could negatively affect 1500 m elite performance, whereas slight SR increases may present a meaningful enhancement (Morais et al., 2023b). Accordingly, better performers specifically reduce SL during the end-spurt while increasing SR to maximize speed, showcasing their discriminant kinematic ability underlying effective pacing. In contrast, G1 swimmers show technical limitations through the inability to effectively adapt their stroke mechanics, resulting in a pacing with high speed variations. The relationship between JC and laps follows a U-shape, reflecting stroke smoothness regulation that supports a conservative race strategy and reverse-J-shaped pacing. Interestingly, this conservative control shared similarities with smoothness regulation observed in open-water races (Bouvet et al., 2023) and 5 km indoor events (Bouvet et al., 2025), as they require high stroke efficiency despite the substantial differences in duration between 400 m and 5 – 10 km. Indeed, the U-shaped population trend reveals two tipping-points. Firstly, the end of the fast start towards a stroke economy period that maximizes the conversion of acceleration variations into speed with economical technique. Secondly, the progressive increase in intra-cyclic acceleration leading to end-spurt launching. Interestingly, only the fastest swimmers deviate from the common pattern by accentuating the U-shape profile, highlighting the decisive value of this stroke mechanical control. Such jerk cost regulation targets to enhance stroke smoothness during the mid-race, by saving energy with less intra-cyclic kinematic variability (Zamparo et al., 2020), and execute a powerful end-spurt using a jerky stroke pattern. This finding highlights the importance of specific management of stroke smoothness, continuously over the course of the 400 m and adapted according to the different race moments, as a critical technical skill to support successful pacing. A limitation of this study is the lack of anthropometric data in interpreting kinematic profiles between performance groups, which may influence stroke mechanics and subsequent preferential kinematic regulation. Future research could investigate how these differences affect pacing, as well as the timing and magnitude of stroke regulation. This would support the refinement of race strategies for optimized performance and provide individualized technical benchmarks for training guidance. Additionally, the findings of this study are based on training conditions involving an in-water start and the computation of stroke mechanics benchmarks from IMU data processing. Therefore, caution should be exercised when comparing them to those from standardized analyses using (semi)-automated video analysis during official swimming competitions (Raineteau et al., 2023).
This study investigated the distinctive regulation of stroke mechanics underpinning pacing patterns in the 400 m freestyle event across different performance levels. By combining pacing and technical profiling with an embedded sensor and modeling with HGAMS, the study highlighted both the common kinematic regulation patterns shared by all swimmers, as well as the group-level deviations that specifically differentiate performance. These insights refine the technical understanding of 400 m pacing strategies. Reducing variability within the common reverse-J-shaped pacing profile was identified as crucial for performance, with underlying stroke regulations playing a decisive role. Shared patterns across the database included an all-out SL profile, a U-shaped JC profile, and a reverse-J-shaped SR profile. However, performance groups diverged in the magnitude and direction of their deviations from this common technical framework. Slower swimmers struggled to maintain effective SR-SL adjustments, resulting in increased pacing variability. Intermediate swimmers exaggerated the fast start, which compromised their mid-race control and end-spurt capacity. In contrast, the fastest swimmers adopted a more economical pacing style, with a relatively slower start and a minimized mid-race speed drop, resulting in a stronger end-spurt than the population trend. This dual picture of shared patterns and group-specific deviations clarifies how pacing consistency and the regulation of stroke mechanics jointly discriminate 400 m performance. The best performers aligned their technical skills with the pacing demands of each race section, managing stroke smoothness and continuously adapting the SR-SL combination. This adaptive ability in stroke mechanics is a distinctive characteristic of the fastest swimmers and should be developed in training. Notably, they mitigated the common variability in reverse-J-shaped pacing by amplifying the magnitude of U-shaped jerk cost regulations, thereby adopting a smoother stroke pattern and sustaining mechanical efficiency up to 250 m. They then shifted to a progressive end-spurt involving greater acceleration fluctuations, although this may require higher metabolic power. Such technical control emerges as decisive for effective pacing. The technical benchmarks identified - an average SL of 1.50 m.stroke-1 combined with an overall SR of around 70 strokes.min-1 - appear critical for optimizing 400 m performance. To meet these criteria, coaches and swimmers should focus on technical development aimed at maximizing stroke smoothness (i.e., reducing intra-cyclic acceleration variability) at race pace. This distinguishing kinematic ability stands out as a key driver of performance improvement. Overall, the study provides actionable insights for designing training plans that develop technical expertise and enhance 400 m pacing.
| ACKNOWLEDGEMENTS |
We are grateful to the athletes for their kind collaboration. This research was funded by the French Agence Nationale de la Recherche within the NePTUNE project (ANR-19-STHP-004) and conducted within the framework of the PIA EUR DIGISPORT project (ANR-18-EURE-0022). Antoine Bouvet was supported by a Ph.D. scholarship from the Ecole Normale Supérieure de Rennes. The authors declare no conflicts of interest and that they do not have any financial disclosures to make. The experiments comply with the current laws of the country in which they were performed. The datasets generated during and/or analyzed during the current study are not publicly available but are available from the corresponding author, who was an organizer of the study. |
|
| AUTHOR BIOGRAPHY |
|
 |
Antoine Bouvet |
| Employment: PhD Student, M2S Laboratory, Université Rennes 2, France |
| Degree: PhD |
| Research interests: Biomechanics, Sports performance |
| E-mail: antoine.bouvet@ens-rennes.fr |
| |
 |
Nicolas Bideau |
| Employment: Assoc. Prof., M2S Laboratory, University Rennes 2, France |
| Degree: PhD |
| Research interests: Biomechanics, Sports performance |
| E-mail: nicolas.bideau@univ-rennes2.fr |
| |
|
| |
| REFERENCES |
 Abbiss C. R., Laursen P. B. (2008) Describing and understanding pacing strategies during athletic competition. Sports Medicine 38, 239-252. Crossref |
Barbosa T. M., Fernandes R. J., Keskinen K. L., Vilas-Boas J. P. (2008) The influence of stroke mechanics into energy cost of elite swimmers. European Journal of Applied Physiology 103, 139-149. Crossref |
Barroso R., Crivoi E., Foster C., Barbosa A. C. (2021) How do swimmers pace the 400 m freestyle and what affects the pacing pattern?. Research in Sports Medicine 29, 598-604. Crossref |
Bouvet A., Pla R., Delhaye E., Nicolas G., Bideau N. (2023) Profiles of stroke regulations discriminate between finishing positions during international open water races. Journal of Sports Sciences 41, 1309-1316. Crossref |
Bouvet A., Pla R., Delhaye E., Nicolas G., Bideau N. (2024) Profiling biomechanical abilities during sprint front-crawl swimming using IMU and functional clustering of variabilities. Sports Biomechanics , 1-21. Crossref |
Bouvet A., Pla R., Nicolas G., Bideau N. (2025) Technical stroke regulations discriminate pacing effectiveness during a 5-km indoor pool race. International Journal of Sports Physiology and Performance 20, 420-428. Crossref |
Casado A., Hanley B., Jiménez-Reyes P., Renfree A. (2021) Pacing profiles and tactical behaviors of elite runners. Journal of Sport and Health Science 10, 537-549. Crossref |
Cohen, J. (1988) Statistical power analysis for the behavioral sciences
(2nd ed.). L. Erlbaum Associates. |
Correia R. D. A., Feitosa W. G., Castro F. A. D. S. (2023) Kinematic, arm-stroke efficiency, coordination, and energetic parameters of the 400-m front-crawl test: A meta-analysis. Frontiers in Sports and Active Living 5, 977739. Crossref |
Correia R. D. A., Feitosa W. G., Figueiredo P., Papoti M., Castro F. A. D. S. (2020) The 400-m front crawl test: energetic and 3d kinematical analyses. International Journal of Sports Medicine 41, 21-26. Crossref |
Costill D., Kovaleski J., Porter D., Kirwan J., Fielding R., King D. (1985) Energy expenditure during front crawl swimming: predicting success in middle-distance events. International Journal of Sports Medicine 6, 266-270. Crossref |
Craig A. B., Skehan P. L., Pawelczyk J. A., Boomer W. L. (1985) Velocity, stroke rate, and distance per stroke during elite swimming competition. Medicine & Science in Sports & Exercise 17, 625-634. Crossref |
Delhaye E., Bouvet A., Nicolas G., Vilas-Boas J. P., Bideau B., Bideau N. (2022) Automatic swimming activity recognition and lap time assessment based on a single IMU: a deep learning approach. Sensors 22, 5786. Crossref |
Demarie S., Pycke J. R., Pizzuti A., Billat V. (2023) Pacing strategy of 800 m and 1500 m freestyle swimming finals in the world championships according to the performance in males and females of different age groups. Applied Sciences 13, 10515. Crossref |
Fernandes A., Afonso J., Noronha F., Mezêncio B., Vilas-Boas J. P., Fernandes R. J. (2023) Intracycle velocity variation in swimming: a systematic scoping review. Bioengineering 10, 308. Crossref |
Foster C., Hendrickson K. J., Peyer K., Reiner B., de Koning J. J., Lucia A., Battista R. A., Hettinga F. J., Porcari J. P., Wright G. (2009) Pattern of developing the performance template. British Journal of Sports Medicine 43, 765-769. Crossref |
Ganzevles S. P. M., Beek P. J., Daanen H. A. M., Coolen B. M. A., Truijens M. J. (2023) Differences in swimming smoothness between elite and non-elite swimmers. Sports Biomechanics 22, 675-688. Crossref |
Havriluk R. (2009) Analyzing hand force in swimming. Three typical limiting factors. ASCA Newsletter , 22-26. |
Huot-Marchand F., Nesi X., Sidney M., Alberty M., Pelayo P. (2005) Swimming: Variations of stroking parameters associated with 200 m competitive performance improvement in top-standard front crawl swimmers. Sports Biomechanics 4, 89-100. Crossref |
Kiely J., Pickering C., Collins D. J. (2019) Smoothness: an unexplored window into coordinated running proficiency. Sports Medicine - Open 5, 43. Crossref |
Komar J., Leprêtre P. M., Alberty M., Vantorre J., Fernandes R. J., Hellard P., Chollet D., Seifert L. (2012) Effect of increasing energy cost on arm coordination in elite sprint swimmers. Human Movement Science 31, 620-629. Crossref |
Laffite L. P., Vilas-Boas J. P., Demarle A., Silva J., Fernandes R., Billat V. L. (2004) Changes in physiological and stroke parameters during a maximal 400-m free swimming test in elite swimmers. Canadian Journal of Applied Physiology 29, 17-31. Crossref |
Leblanc H., Seifert L., Tourny-Chollet C., Chollet D. (2007) Intra-cyclic distance per stroke phase, velocity fluctuations and acceleration time ratio of a breaststroker’s hip: a comparison between elite and nonelite swimmers at different race paces. International Journal of Sports Medicine 28, 140-147. Crossref |
Lipinska P. (2011) Kinematics tactics in swimming races on the example of the Beijing 2008 Olympic Games and the Rome 2009 World Championships. Baltic Journal of Health and Physical Activity 3. Crossref |
Lipinska P., Allen S. V., Hopkins W. G. (2016a) Modeling parameters that characterize pacing of elite female 800-m freestyle swimmers. European Journal of Sport Science 16, 287-292. Crossref |
Lipinska P., Allen S. V., Hopkins W. G. (2016b) Relationships between pacing parameters and performance of elite male 1500-m swimmers. International Journal of Sports Physiology and Performance 11, 159-163. Crossref |
Lipinska P., Hopkins W. G. (2020) Pacing profiles and competitive performance of elite female 400-m freestyle swimmers. Journal of Strength and Conditioning Research 34, 218-224. Crossref |
Mauger A. R., Neuloh J., Castle P. C. (2012) Analysis of pacing strategy selection in elite 400-m freestyle swimming. Medicine & Science in Sports & Exercise 44, 2205-2212. Crossref |
McGibbon K. E., Pyne D. B., Shephard M. E., Thompson K. G. (2018) Pacing in swimming: a systematic review. Sports Medicine 48, 1621-1633. Crossref |
McGibbon K., Pyne D., Shephard M., Osborne M., Thompson K. (2020) Contemporary practices of high-performance swimming coaches on pacing skill development and competition preparation. International Journal of Sports Science & Coaching 15, 495-505. Crossref |
Menting S. G. P., Post A. K., Nijenhuis S. B., Koning R. H., Visscher C., Hettinga F. J., Elferink-Gemser M. T. (2023) Pacing behavior development in adolescent swimmers: a large-scale longitudinal data analysis. Medicine & Science in Sports & Exercise 55, 700-709. Crossref |
Morais J. E., Barbosa T. M., Bragada J. A., Nevill A. M., Marinho D. A. (2023a) Race analysis and determination of stroke frequency - stroke length combinations during the 50-m freestyle event. Journal of Sports Science and Medicine , 156-165. Crossref |
Morais J. E., Barbosa T. M., Forte P., Bragada J. A., Castro F. A. D. S., Marinho D. A. (2023b) Stability analysis and prediction of pacing in elite 1500 m freestyle male swimmers. Sports Biomechanics 22, 1496-1513. Crossref |
Morais J. E., Barbosa T. M., Neiva H. P., Marinho D. A. (2019) Stability of pace and turn parameters of elite long-distance swimmers. Human Movement Science 63, 108-119. Crossref |
Morais J. E., Barbosa T. M., Nevill A. M., Cobley S., Marinho D. A. (2022) Understanding the role of propulsion in the prediction of front-crawl swimming velocity and in the relationship between stroke frequency and stroke length. Frontiers in Physiology 13, 876838. Crossref |
Mytton G. J., Archer D. T., Gibson A. S. C., Thompson K. G. (2014) Reliability and stability of performances in 400-m swimming and 1500-m running. International Journal of Sports Physiology and Performance 9, 674-679. Crossref |
Mytton G. J., Archer D. T., Turner L., Skorski S., Renfree A., Thompson K. G., Gibson A. S. C. (2015) Increased variability of lap speeds: differentiating medalists and nonmedalists in middle-distance running and swimming events. International Journal of Sports Physiology and Performance 10, 369-373. Crossref |
Pedersen E. J., Miller D. L., Simpson G. L., Ross N. (2019) Hierarchical generalized additive models in ecology: an introduction with mgcv. PeerJ 7, e6876. Crossref |
Peterson Silveira R., De Souza Castro F. A., Figueiredo P., Vilas-Boas J. P., Zamparo P. (2017) The effects of leg kick on swimming speed and arm-stroke efficiency in the front crawl. International Journal of Sports Physiology and Performance 12, 728-735. Crossref |
Peterson Silveira R., Soares S. M., Zacca R., Alves F. B., Fernandes R. J., Castro F. A. D. S., Vilas-Boas J. P. (2019) A biophysical analysis on the arm stroke efficiency in front crawl swimming: comparing methods and determining the main performance predictors. International Journal of Environmental Research and Public Health 16, 4715. Crossref |
Pla R., Poszalczyk G., Souaissia C., Joulia F., Guimard A. (2021) Underwater and surface swimming parameters reflect performance level in elite swimmers. Frontiers in Physiology 12, 712652. Crossref |
Raineteau Y., Nicolas G., Bideau B., Bideau N., Pla R. (2023) Associations between load-velocity profiling and race parameters of elite swimmers in the 100 and 200m freestyle events. Frontiers in Sports and Active Living 5, 1326106. Crossref |
Robertson E. Y., Pyne D. B., Hopkins W. G., Anson J. M. (2009) Analysis of lap times in international swimming competitions. Journal of Sports Sciences 27, 387-395. Crossref |
Ruiz-Navarro J. J., López-Belmonte Ó., Gay A., Cuenca-Fernández F., Arellano R. (2023) A new model of performance classification to standardize the research results in swimming. European Journal of Sport Science 23, 478-488. Crossref |
Ruiz-Navarro J. J., Morouço P. G., Arellano R. (2020) Relationship between tethered swimming in a flume and swimming performance. International Journal of Sports Physiology and Performance 15, 1087-1094. Crossref |
Skorski S., Faude O., Caviezel S., Meyer T. (2014) Reproducibility of pacing profiles in elite swimmers. International Journal of Sports Physiology and Performance 9, 217-225. Crossref |
Strzała M., Tyka A., Krężałek P. (2007) Physical endurance and swimming technique in 400 meter front crawl race. Journal of Human Kinetics 18, 73-86. |
Taylor J. B., Santi G., Mellalieu S. D. (2016) Freestyle race pacing strategies (400 m) of elite able-bodied swimmers and swimmers with disability at major international championships. Journal of Sports Sciences 34, 1913-1920. Crossref |
Tijani J. M., Lipińska P., Ben Abderrahman A. (2021) 400 meters freestyle pacing strategy and race pace training in age-group swimmers. Acta of Bioengineering and Biomechanics 23. Crossref |
Vorontsov, A. R. and Rumyantsev, V. A. (2000) Resistive forces in
swimming. In V. M. Zatsiorsky (ed.), Biomechanics in Sport (1st ed.), 184-204. Wiley.
Crossref |
Wood S. N. (2003) Thin plate regression splines. Journal of the Royal Statistical Society Series B: Statistical Methodology 65, 95-114. Crossref |
Wood S. N. (2011) Fast stable restricted maximum likelihood and marginal likelihood estimation of semiparametric generalized linear models. Journal of the Royal Statistical Society Series B: Statistical Methodology 73, 3-36. Crossref |
Wood, S. N. (2017) Generalized additive models: an introduction with R
(2nd ed.). Chapman and Hall/CRC. Crossref |
Zacca R., Azevedo R., Peterson Silveira R., Vilas-Boas J. P., Pyne D. B., Castro F. A. D. S., Fernandes R. J. (2019) Comparison of incremental intermittent and time trial testing in age-group swimmers. Journal of Strength and Conditioning Research 33, 801-810. Crossref |
Zamparo P., Cortesi M., Gatta G. (2020) The energy cost of swimming and its determinants. European Journal of Applied Physiology 120, 41-66. Crossref |
|
| |
|
|
|
|